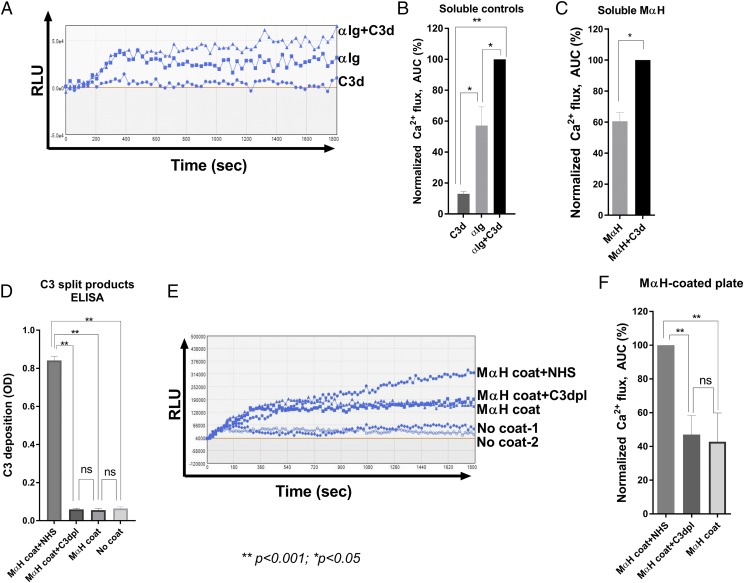
FIGURE 1.
Development of an in vitro assay to study complement-enhanced activation of primary human B cells. (A) Activation of B cells by soluble ligands. Representative Ca2+ flux traces of Fluo-4–stained cells induced with soluble complement C3d (2 μg/ml), BCR cross-linking Ab anti-Ig (2 μg/ml), or a combination of both. (B) Normalized Ca2+ flux calculated as the area under the curve (AUC) and normalized to anti-Ig+C3d. (C) Activation of B cells by soluble mouse anti-human or mouse anti-human+C3d. Ca2+ flux is normalized to mouse anti-human+C3d. (D) C3-split product ELISA of mouse anti-human–coated wells after complement activation from the following sources: 5% untreated NHS (NHS), 5% human C3dpl, no serum (mouse anti-human coat), or uncoated wells exposed to 5% NHS (no coat). (E) Activation of B cells by mouse anti-human plates with deposited complement. Representative Ca2+ flux traces of Fluo-4–stained primary normal human B cells incubated in wells coated with mouse anti-human (mouse anti-human coat) in wells coated with mouse anti-human and exposed to 5% NHS (mouse anti-human coat+NHS), 5% human C3dpl (mouse anti-human coat+C3dpl), or incubated in uncoated wells treated with 5% NHS (no coat 1, 2). (F) Normalized Ca2+ flux in cells treated as in (E). Data shown in (B)–(D) and (F) are mean values from at least three independent experiments with B cells from separate donors. Data in (F) are normalized using the following formula: Relative value = 100 × (ValueX−Valueno coat)/(Valuemouse anti-human+NHS−Valueno coat). Data in (B)–(D) and (F) are mean values. Error bars are SEM. Statistics were performed using a one-way ANOVA. *p < 0.05, **p < 0.001. αIg, anti-Ig; MαH, mouse anti-human; RLU, relative luminescence unit.

