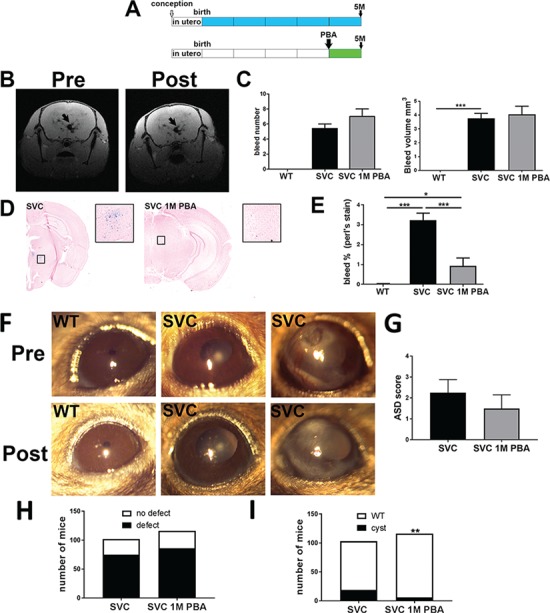
Figure 3.

PBA treatment of established disease. (A) Diagram of 1-month oral PBA treatment for the treatment of established phenotypes in 5-month-old mice. (B) MRI image of a mutant animal pre and post treatment reveals ICH (black arrow). (C) ImageJ analysis of MRI data based on bleed number (top) and bleed volume (bottom) (SVC n = 11, SVC PBA n = 8). (D) Perl’s staining of brains sections reveals ICH (blue staining) untreated and treated mutant mice (SVC and SVC 1 M PBA). (E) Image analysis indicating percentage of tissue that stained positive for ICH (n = 3). (F) Slit lamp analysis reveals persistence of corneal opacity and iris hypoplasia. The images are of the same eye of the animal pre and post treatment (n = 4 animals). (G) Scoring of anterior segment (presence/absence of iridocorneal adhesion, ciliary body morphology, presence/absence of open Shlemm’s canal) in untreated (SVC) and treated Col4a1+/SVC (SVC 1M PBA). (SVC n = 4, SVC 1M PBA n = 4 mice) (H) Image analysis of Bowman’s capsule defects in untreated and treated mice (n = 116). (I) Image analysis of glomerulocystic defects (χ2 = 9.506; 1 df, P = 0.002). (Histopathology of the eye and kidney is provided in Supplementary Material, Figs S2 and S3). (D), (E) One-way ANOVA with Bonferonni post hoc test; (F) Two-sided chi-square *P-value < 0.05, ***P-value < 0.001.
