
Figure 4.
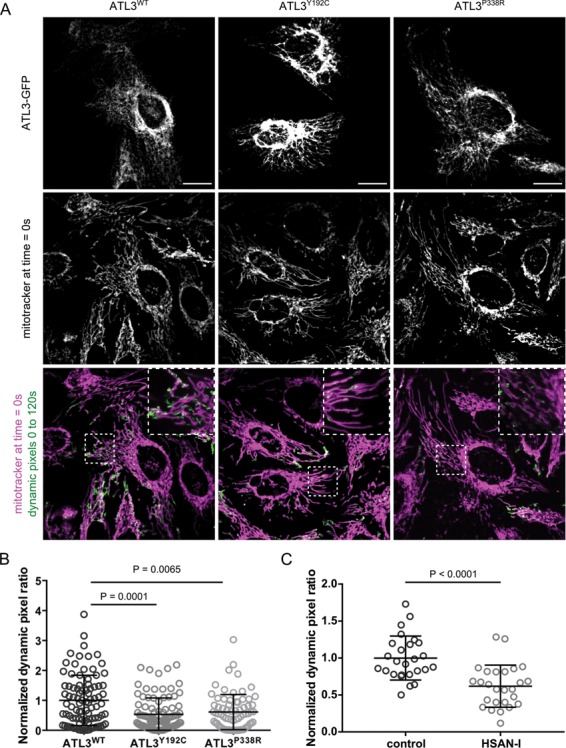
HSAN-causing mutations in ATL3 interfere with mitochondrial trafficking. (A) HeLa cells were transfected with GFP-tagged ATL3WT, ATL3Y192C or ATL3P338R and mitochondria were labelled using Mitotracker Red. Live cell imaging was performed for 2 min with 2 s time intervals. To determine mitochondrial motility, the dynamic pixels in each frame were extracted with the ImageJ Difference tracker plugin (Supplementary Material, Video and Fig. S3). A summed intensity projection of these dynamic pixels over the entire time sequence is shown in green. A zoom of the boxed area is shown. Scale bar and box width, 20 μm. (B) Dynamic pixels were quantified for each cell in three independent experiments, and the normalized data were pooled (mean ± SEM is shown, N = 73–95 cells per genotype). One-way ANOVA and a Kruskal–Wallis test were performed. (C) Control and HSAN-I patient fibroblasts were analysed in three independent experiments as in A and B (Supplementary Material, Video and Fig. S3). N = 36 cells for each genotype. An unpaired t-test was performed.