Figure 2.

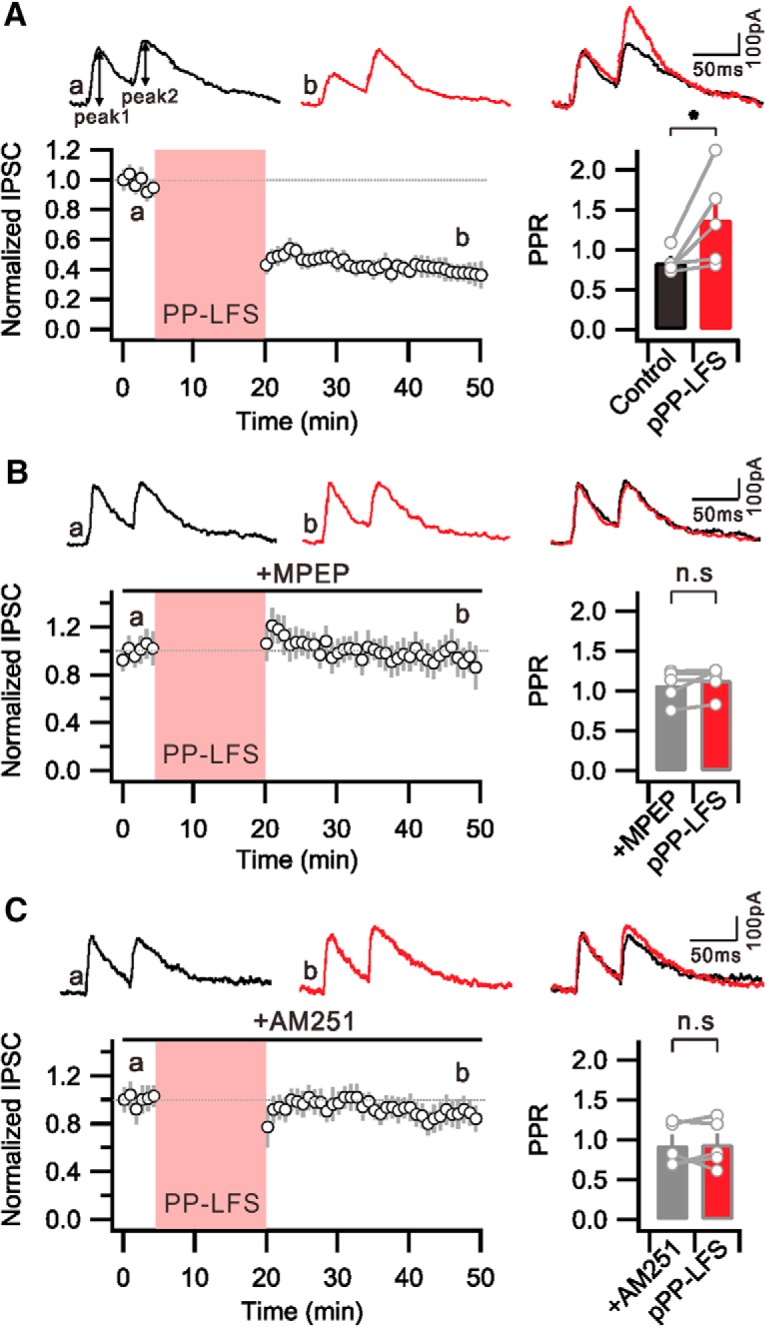
PP-LFS-induced i-LTD is mediated by mGluR/eCB signaling. A, Graph showing PP-LFS at SC fibers induced LTD of IPSC magnitude. Bar graphs representing that PPR of IPSC is significantly increased after PP-LFS. B, PP-LFS-induced i-LTD is not expressed in the presence of MPEP. The PPR of IPSC is not increased after PP-LFS. C, Graph showing that the PP-LFS-induced i-LTD is significantly blocked by inhibiting CB1Rs. The PPR of IPSC in the presence of AM251 remains unchanged after PP-LFS. A–C, Insets, Top, Representative IPSC traces before PP-LFS (a, black) and 25–30 min after PP-LFS (b, red). *p < 0.05. n.s., Not significant (p > 0.05). Error bars indicate SEM.
