Figure 3.
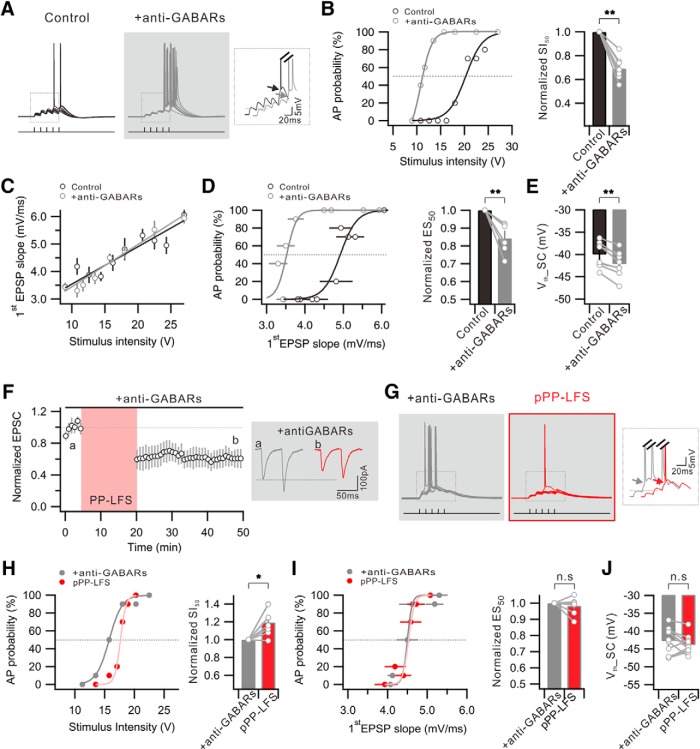
GABAR blockers mimic and occlude E-S potentiation associated with Vth hyperpolarization during e-LTDPP-LFS. A, Example traces of the voltage responses to 10 trials of suprathreshold SC stimulation obtained before (Control) and after GABAR antagonist application (+anti-GABARs). Inset, Superimposed voltage traces indicating hyperpolarized Vth. B, Graph showing distribution of firing probability as a function of stimulus voltage before (Control) and after anti-GABAR application (+anti-GABARs). Bar graph represents significant decrease of SI50 by GABAR blockade. C, No significant change is detected in the ratio of the first EPSP slope to stimulus intensity after the anti-GABAR application. D, Plot of firing probability as a function of first EPSP slope. Bar graphs represent a significant decrease in ES50 by GABAR inhibition. E, Summary data showing significant Vth hyperpolarization that APs induced by SC stimulation (Vth_SC). F, The e-LTDPP-LFS is still induced in the presence of anti-GABARs. Inset, EPSC traces obtained before (a) and 25–30 min after PP-LFS (b). G, Voltage responses to 10 trials of suprathreshold SC stimulation before (+anti-GABARs) and after PP-LFS (pPP-LFS) in the presence of anti-GABARs during entire recordings. Inset, No significant change in Vth. H, Distribution of firing probability as a function of stimulus voltage before (+anti-GABARs) and after PP-LFS (pPP-LFS) in the presence anti-GABARs. Right, Bar graphs represent significant increase in SI50. I, No significant change is detected in AP probability versus first EPSP slope. Bar graphs represent no significant change in ES50. J, Vth shift by PP-LFS is occluded in the presence of anti-GABARs. *p < 0.05. **p < 0.01. n.s., Not significant (p > 0.05). Error bars indicate SEM.

