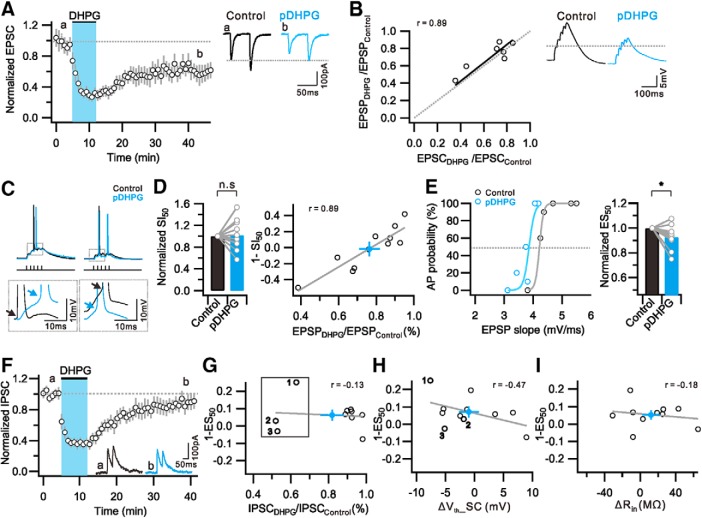
Figure 7.
DHPG induce e-LTD with weak E-S potentiation, but no significant i-LTD. A, Time course and magnitude of synaptic depression by bath application of DHPG. B, Ratio of first EPSP change (EPSPDHPG/EPSPControl) is plotted against first EPSC change (EPSPDHPG/EPSPControl). Fitted line of data is presented with solid line (black), and a linear correlation is observed (r = 0.89). Right, Representative traces of EPSCs (A) and EPSPs (B) during the baseline period (0–5 min) (Control, black) and 25–30 min after DHPG application (pDHPG, light blue). C, Representative voltage traces by suprathreshold SC stimulation before (Control) and after DHPG application (pDHPG). Insets, DHPG-induced variable results in depolarization (left) or hyperpolarization (right) of Vth. D, Bar graphs represent no significant changes in SI50. Graph shows strong linear relationship between 1-SI50 and EPSP weight (r = 0.89). E, Distribution of firing probability as a function of EPSP slope before (Control) and 30 min after DHPG application (pDHPG). Light colors represent sigmoid fitted line. Bar graphs represent significant decrease in ES50. F, Time course and magnitude of i-LTD by DHPG application. Inset, Representative IPSC traces obtained before (a) and 25–30 min after DHPG application (b). G, No correlation is detected between 1-ES50 and IPSC weight (r = −0.13). Samples that show IPSC decreases >20% after DHPG are numbered and indicated with box. H, Graph showing a linear correlation between 1-ES50 and ΔVth_SC (r = −0.47). Numbers indicate 3 cells that show significant i-LTD in Figure 7G. I, No correlation is detected between 1-ES50 and ΔRin (r = −0.18). D, G, H, I, Closed circles (light blue) and gray solid lines at indicate averaged number and fitted line of data, respectively. Error bars indicate SEM. *p < 0.05. n.s., Not significant (p > 0.05).

