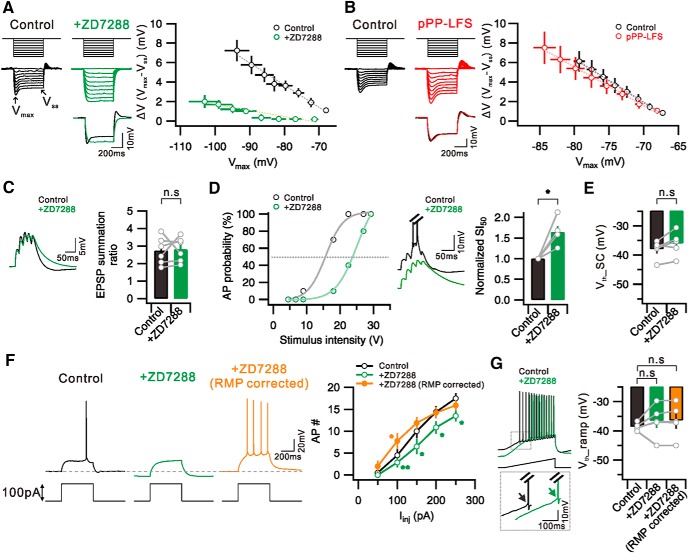
Figure 8.
Effects of ZD7288, Ih blocker, on intrinsic excitability and E-S coupling in CA1 neurons. A, Left, Voltage deflections in response to a series of current steps (−200 to 0 pA, 25 pA increment) before (Control) and after ZD7288 application (+ZD7288). Vmax, Maximum point of voltage deflection; Vss: steady state of voltage deflection. Bottom, Voltage response to −200 pA current injection in Control and the similar level of Vmax shown at +ZD7288 are superimposed. Right, ΔV (Vmax − Vss) is plotted against Vmax before (Control) and after ZD7288 application (+ZD7288). B, Left, Representative voltage deflections to current steps before (Control) and 30 min after PP-LFS (pPP-LFS). Right, ΔV (Vmax − Vss) versus Vmax in Control and after PP-LFS are plotted with black and red colors, respectively. C, Left, Example traces of EPSP before (Control) and after ZD7288 application (+ZD7288) by subthreshold synaptic stimulation at 50 Hz. Bar graphs represent no significant changes in EPSP summation ratio by ZD7288 application. D, Left, Plot of firing probability as a function of stimulus intensity before (Control) and after ZD7288 application (+ZD7288). Middle, Example traces of voltage changes in response to a same intensity of synaptic stimulation. Note the decrease in AP firing with the Ih inhibition. Right, Summary graphs of increased SI50 by Ih inhibition. E, Bar graphs represent no significant changes in Vth_SC in the presence of ZD7288. F, Left, Representative voltage traces to current step (100 pA) before (Control), after ZD7288 application (+ZD7288), and RMP corrected with current injection (+ZD7288, RMP corrected). Right, summary data showing significant decrease in AP firing in the presence of ZD7288. There was an increase in AP firing by correcting RMP. G, Voltage responses to ramp current injection before (Control) and after ZD7288 application (+ZD7288). Inset, Bottom, Traces at boxed area are superimposed. Bar graphs represent no significant changes in Vth_ramp. F, *p < 0.05. **p < 0.01. n.s., Not significant (p > 0.05). Error bars indicate SEM.

