Figure 3.
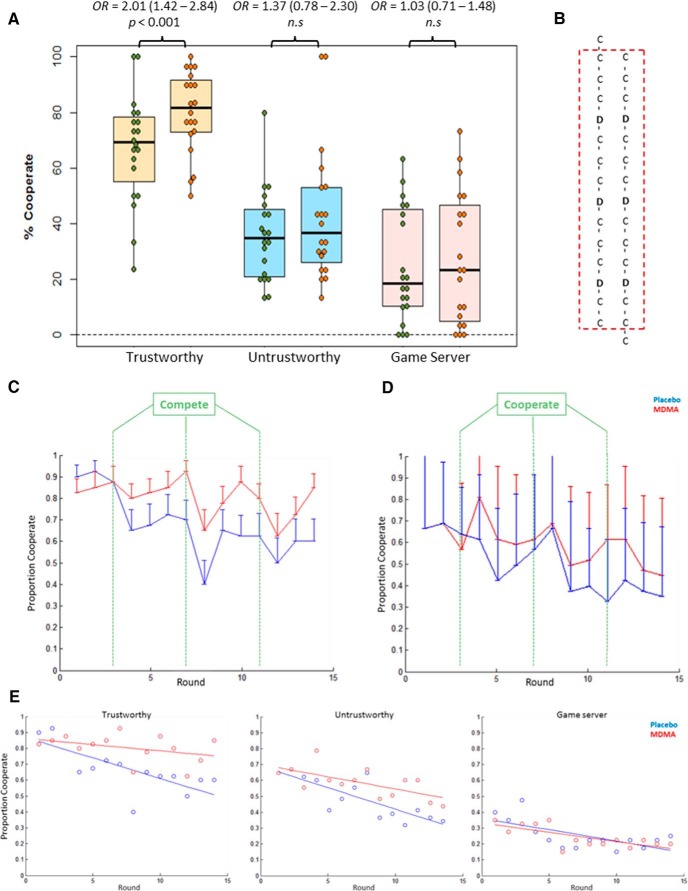
Boxplots: A, PD cooperation rates with each type of opponent. Green dots represent placebo session. Orange dots represent MDMA session. B, The sequence of opponent responses. Here we show the lining up of decisions across runs: to account for the jitter in opponent responses, the last trial of the first run and first trial of the final run were removed. “C,” Opponents were congruous with their trustworthiness; “D,” opponents deviated from this. C, Proportion of cooperate decisions on each round, averaged across participants, for the trustworthy opponent. D, Proportion of cooperate decisions on each round, averaged across participants for the untrustworthy opponent. E, Proportion of cooperate decisions on each round plotted as scatterplots with the line of best fit for each session; for the trustworthy opponent, there is a steady decline in cooperative decisions during the placebo session, which does not occur during the MDMA session (generalized estimating equation round × experimental session interaction: χ2(1,19) = 16.79, OR = 1.08; 95% CI, 1.04–1.13, p < 0.001). The parameter estimate for a quadratic fit of trial number was not statistically significant. Error bars indicate SE.

