Figure 1.
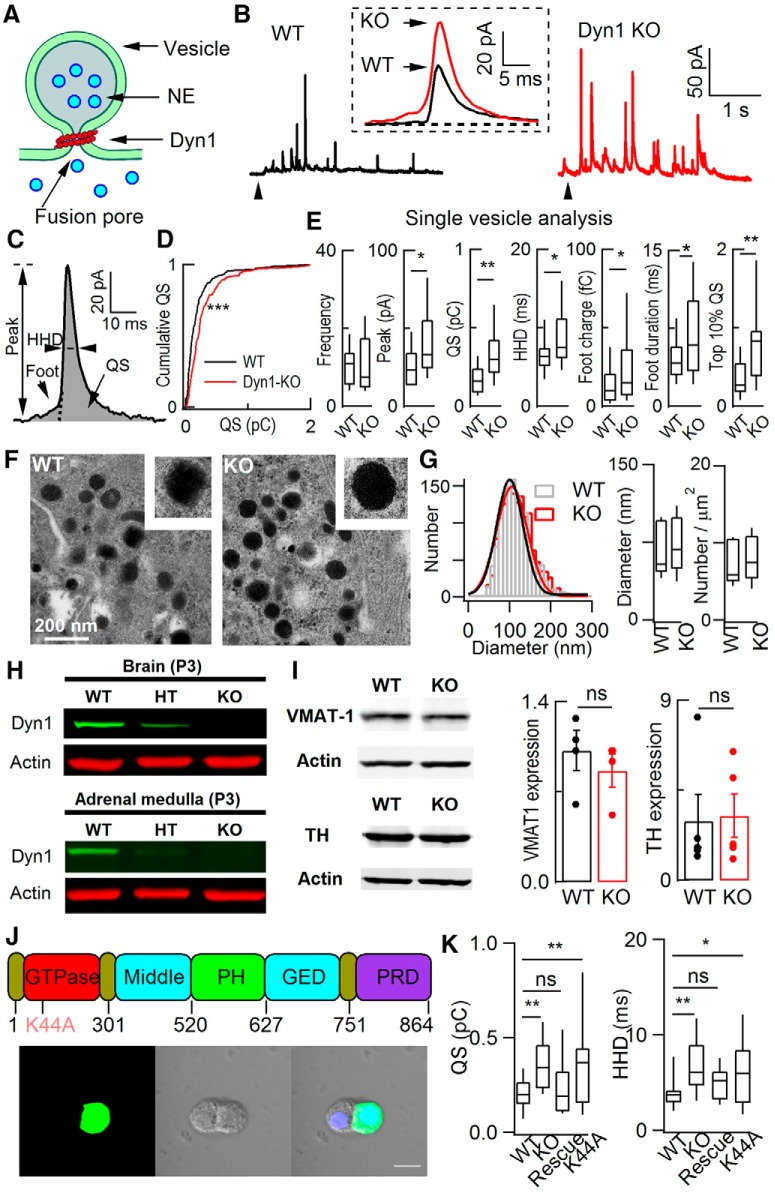
dyn1-KO increased quantal size in native ACCs. A, Diagram depicting a fusion event between vesicle and plasma membrane, local catecholamine dyn1 and fusion pore. B, Representative amperometric recordings of catecholamine release from WT and dyn1-KO ACCs evoked by 20 mm caffeine. Insert, Enlarged and averaged quantal events from WT and KO cells (each from 20 amperometric spikes among the fastest 10%, recorded from these two cells; Zhou et al., 1996). C, Quantal event with defined parameters. D, Cumulative analysis of QS in WT and dyn1-KO. Kolmogorov–Smirnov test, p < 0.001. E, Quantitative analysis of single-vesicle release events (quanta). Analyzed spikes met the 5 SD threshold criterion (Chen et al., 2005). Data are from 18 cells and 162 quanta for WT, 15 cells and 224 quanta for KO. The median for quantal size increased from 0.13 pC (WT) to 0.25 pC (KO). Overlapping events that could not be separated from each other were removed from the statistics. F, Representative EM images of sections from WT (left) and KO (right) cells. LDCVs are dispersed throughout the cytoplasm in both cell types. Scale bar, 200 nm. G, Distribution and statistics of vesicle diameter and vesicle number per square micrometer. Left, Single Gaussian fitting of the distributions superimposed on the bar graphs [total of 1341 (WT, 15 cells) and 1414 vesicles (dyn1 KO, 16 cells)]. Right, Statistics of vesicle size and number per square micrometer for WT and dyn1-KO cells. H, dyn1 expression and KO in brain and adrenal mudulla of P3 mice. dyn1-KO mice were killed and brain (positive control) and ACC tissues were isolated for Western blot. Representative images of three independent repeats are shown. HT, Heterozygous. I, VMAT-1 and TH expression in adrenal medulla from WT and dyn1-KO mice. Four independent experiments were performed. For VMAT-1, from 6 WT littermates and 6 KO mice and 5 independent experiments; for TH, from 8 WT littermates and 8 KO mice. J, Top, Diagram illustrating the functional domains of dyn1 and its GTPase dominant-negative mutation K44A. Bottom, Two sister ACCs of the intact (left) and the dyn1 cell by transfected electroporation (right). Scale bar, 10 μm. K, Statistics of dyn1 rescue. WT: n = 19; KO: n = 23; rescue: dyn1-KO was rescued by WT-dyn1 (n = 23); K44A: dyn1-KO was not rescued by dyn1-K44A (n = 15); one-way ANOVA. In all figures, animal numbers varied from three to five pairs of WT and KO littermates. Data are presented as medians with interquartile ranges (NS for p > 0.05, *p < 0.05, **p < 0.01, ***p < 0.001, two-tailed unpaired t test for E, G, and I; one-way ANOVA for K).

