Figure 6.
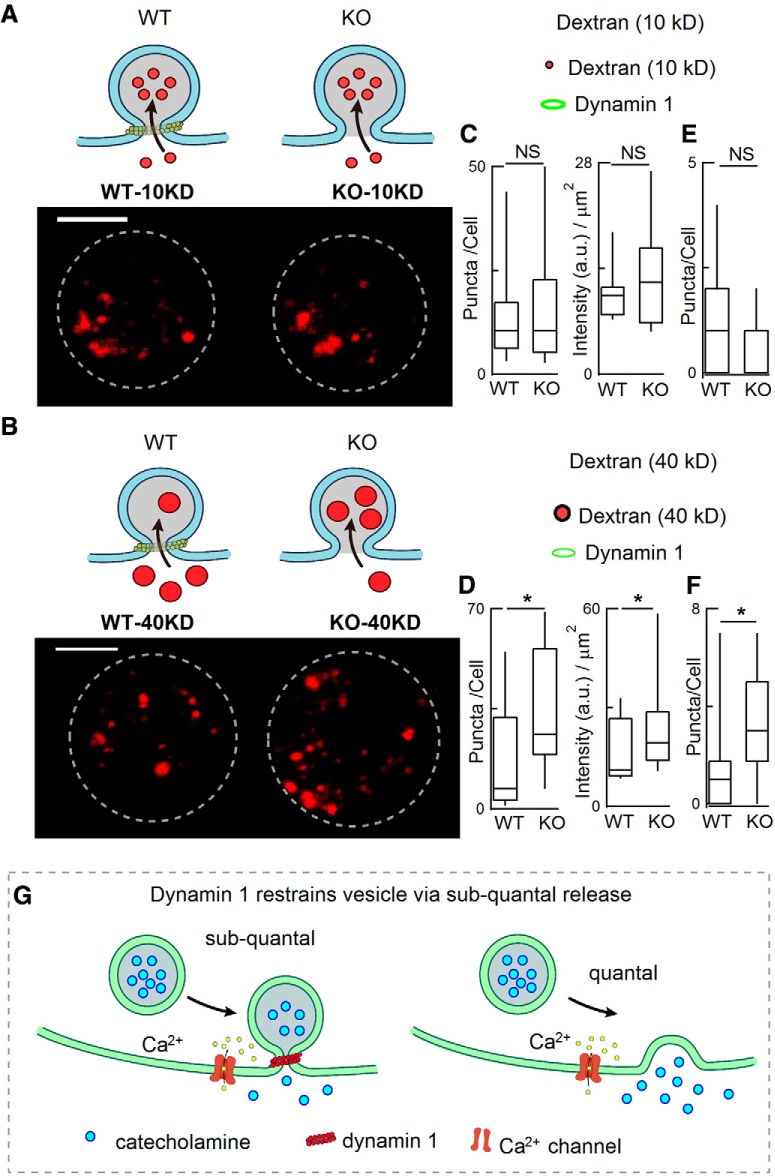
dyn1-KO increased the endocytic uptake of large dextran nanoparticles. A, B, Diagrams (top) and representative images (bottom) showing the uptake of TMR-dextran during 70 mm KCl stimulation for 1 min. Diagrams (A) show that small (10 kD) TMR-dextran was easily taken up by both WT and KO cells, whereas large (40 kD) TMR-dextran was more selectively taken up by KO cells (B). C, D, statistics of TMR-dextran number/cell and intensity/square micrometer [10 kDa TMR-dextran Φ 5 nm, 40 kDa TMR-dextran Φ ∼ 9 nm; 19 WT-cells (10 kDa), 19 WT-cells (40 kDa), 16 KO-cells (10 kDa), 19 KO-cells (40 kDa)]. Cells were from the same 4 WT mice and 4 KO littermates. Scale bar, 5 μm. E, F, Statistics of 10 KD TMR-dextran puncta taken up by WT (n = 9 cells) and dyn1-KO cells (n = 12 cells) without K+ stimulation (E); statistics of 40 KD TMR-dextran puncta taken up by WT (n = 16 cells) and dyn1-KO cells (n = 18 cells) without K+ stimulation (F), the large (40 KD) TMR-dextran was more selectively taken up by KO than by WT cells. Cells were from littermates (3 WT and 3 KO). Data are presented as median with interquartile range, *p < 0.05, two-tailed unpaired t test. G, Model of fusion pore and release modes regulated by dyn1. Left, Diagram depicting vesicle fusion with the plasma membrane while the fusion pore expansion is restricted by dyn1, resulting in subquantal release (KAR). Right, in the absence of dynamin 1, the fusion pore expands more, resulting in full-quantal release (“full-fusion”). Data are presented as median with interquartile range (NS for p > 0.05, *p < 0.05, two-tailed unpaired t test).

