
Figure 3.
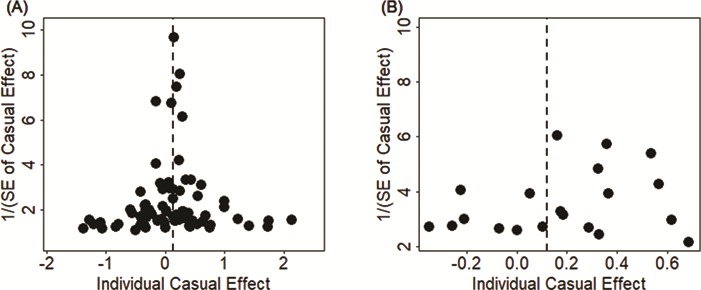
Funnel plot displays causal effect estimates of LDL on ALS obtained using individual SNP instruments in the European population (A) and the East Asian population (B). Center of the dots represents the estimated causal effect (log OR) for each instrumental variable. The vertical dotted lines represent the estimated causal effect obtained using all instrumental variables.