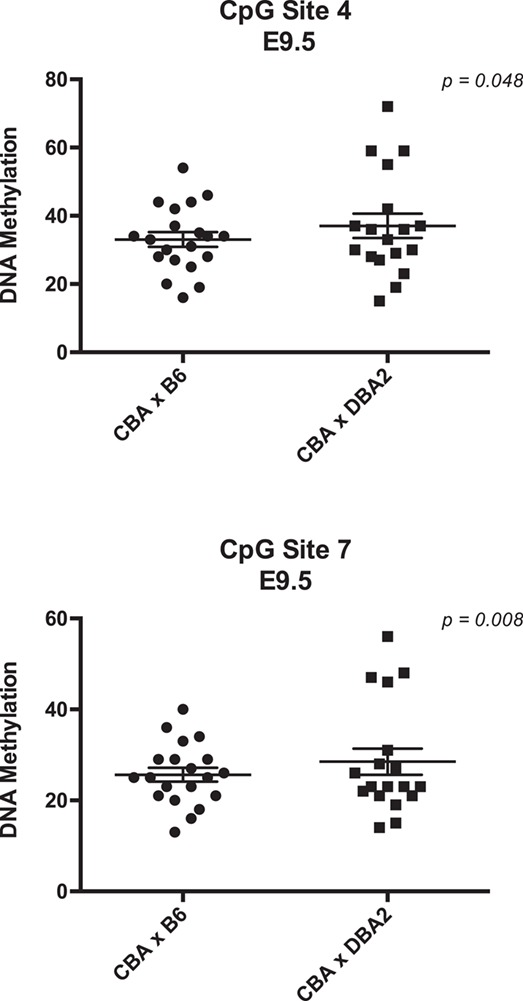
Figure 4.

Analysis of DNA methylation of Ido1 in a spontaneous abortion mouse model. Distribution of methylation levels for CBA X DBA2 (n = 18) and CBA X B6 (n = 20) at CpG sites 4 and 7. Each data point represents one placenta. All error bars represent SEM. Data were analyzed using F variance ratio test. P < 0.05 for all statistical analysis.
