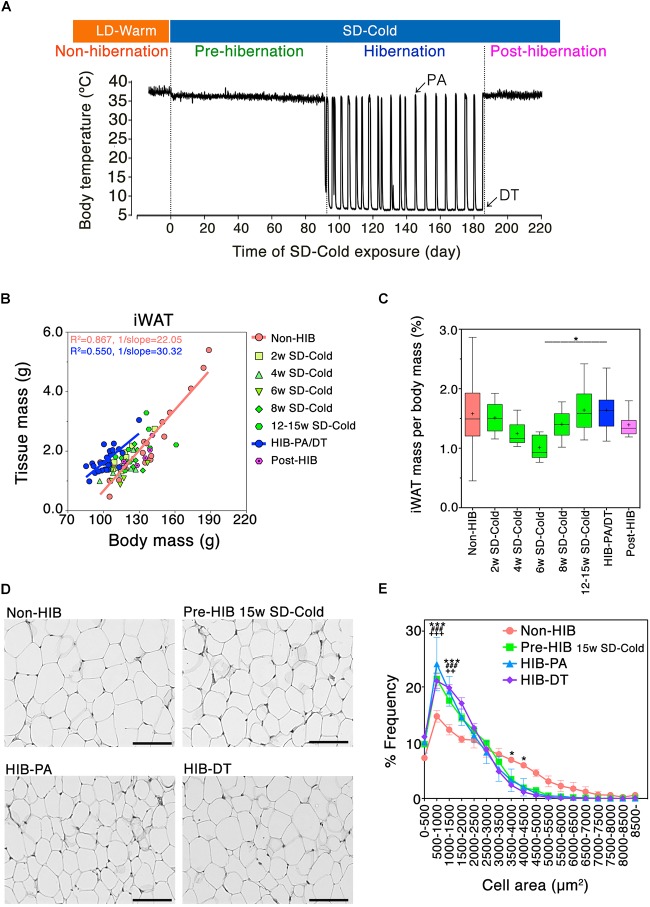
FIGURE 1.
Mass and morphological changes of iWAT during the transitional period from non-hibernation state to hibernation state. (A) A representative change in core body temperature of hamsters measured by intraperitoneally implanted core body temperature loggers. At Post-hibernation, animals spontaneously terminated hibernation while still being kept in SD-Cold conditions. (B) Positive correlation of adipose tissue mass with body mass of hamsters: orange line; Non-HIB group, R2 = 0.867, 1/slope = 22.05, P < 0.0001: blue line; HIB-PA/DT group; R2 = 0.550, 1/slope = 30.32, P < 0.0001. Non-HIB, non-hibernation group under LD-Warm conditions (n = 20); 2/4/6/8/12–15 weeks SD-Cold, pre-hibernation group at different time points after the transfer to an SD-Cold environment (n = 8, 8, 5, 8, and 8, respectively); HIB-PA/DT, hibernation group combing both PA and DT (n = 21); Post-HIB, post-hibernation group (n = 7). (C) Changes of iWAT-to-body mass ratio over time. Horizontal lines and crosses indicate medians and means of iWAT-to-body mass ratio, respectively. Boxes enclose the interquartile ranges and whiskers show the minimum and maximum iWAT-to-body mass ratio of each experimental group. ∗p < 0.05 between the “6 weeks SD-Cold” and “HIB-PA/DT,” assessed by one-way ANOVA followed by analysis using Tukey’s multiple comparison tests. (D,E) H&E staining (D) and the frequency distribution of adipocyte cell size (E) in iWAT from the four different states (n = 3 for each condition). The results are expressed as mean ± SEM. P-value was derived using two-way ANOVA and Bonferroni post-tests. Significant differences are marked by ∗ between “HIB-DT” and “Non-HIB,” # between “HIB-PA” and “Non-HIB,” and by + between “Pre-HIB” and “Non-HIB”. ∗, #, +p < 0.05, ∗∗, ##, ++p < 0.01, ∗∗∗, ###, +++p < 0.005.

