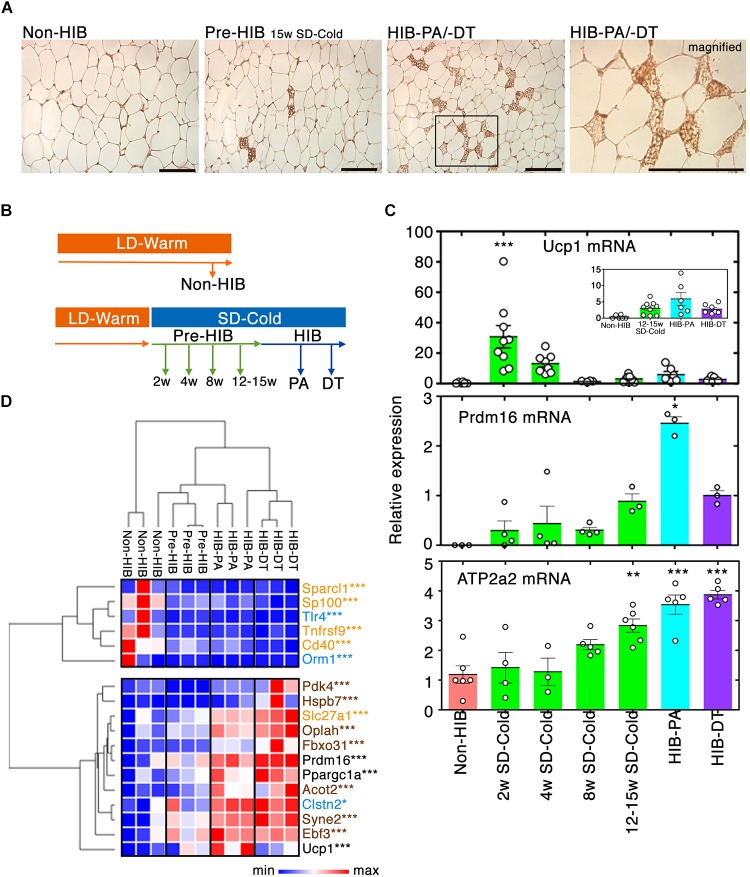
FIGURE 2.
Recruitment of beige-like cells to iWAT by prolonged SD-Cold exposure. (A) Representative images of UCP1 staining of iWAT from each condition. The numbers of iWAT with beige-like cells in Non-HIB, Pre-HIB, HIB-PA, and HIB-DT were 0/6, 5/6, 2/3, and 2/3, respectively. Scale bars, 100 μm. (B,C) Time-course analysis of Ucp1 and Prdm16 mRNA expression in iWAT by qPCR. (B) Schematic overview of time-course analysis. (C) Relative expression of Ucp1, Prdm16, and Atp2a2 mRNA expression. The numbers of samples analyzed for Ucp1 mRNA were Non-HIB: n = 6, 2/4/8/12–15 weeks SD-Cold: n = 9, 8, 4, and 8, respectively, HIB-PA: n = 6, and HIB-DT: n = 7. Those for Prdm16 mRNA were Non-HIB: n = 3, 2/4/8/12–15 weeks SD-Cold: n = 4, 4, 4, and 3, respectively, HIB-PA: n = 3, and HIB-DT: n = 3. Those for Atp2a2 mRNA were Non-HIB: n = 6, 2/4/8/12–15 weeks SD-Cold: n = 4, 3, 5, and 6, respectively, HIB-PA: n = 5, and HIB-DT: n = 5. The results are expressed as mean ± SEM. White circles show each animal. P-value was derived using one-way ANOVA and Tukey’s multiple comparison tests. ∗p < 0.05, ∗∗p < 0.01, ∗∗∗p < 0.005 against the “Non-HIB group.” (D) Heat map representation of relative expression changes of genes in the beige/brown adipocyte signature as differentially expressed with q-value ≤ 0.01 and more than twofold change between any groups. Blue, orange, and brown characters indicate marker genes for WAs, beige adipocytes, and brown adipocytes, respectively. Pre-HIB here indicates pre-hibernation group following 15 weeks of exposure to SD-Cold conditions. ∗q < 0.05, ∗∗q < 0.01, ∗∗∗q < 0.005.

