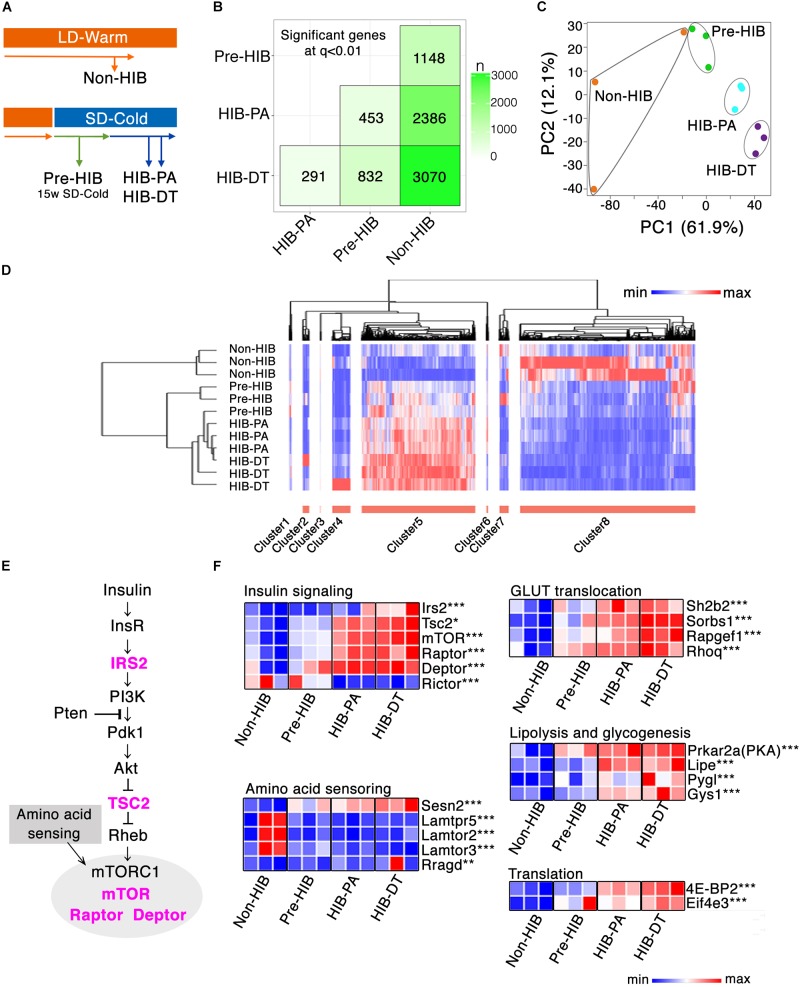
FIGURE 3.
Global gene expression profiling of iWAT. (A) Schematic overview of the four experimental groups that were used for RNA-seq analysis of iWAT (n = 3 per group). (B) SigMatrix plot indicating the number of DEGs among each combination of groups at 0.01 q-value threshold. (C) Principle component analysis on 3804 genes. PC1, principle component 1; PC2, principle component 2. (D) Hierarchal clustering analysis on the screened 2831 DEGs, which exhibited more than twofold change between any groups with q-value ≤ 0.01. Relative mRNA expression level among four groups are denoted in red (high expression) to blue (low expression) gradient. (E,F) mRNA expression changes of genes involved in insulin signaling. (E) Insulin-Akt-mTORC1 signaling cascade. The genes colored in magenta denote the significant up-regulation either in HIB-PA or HIB-DT compared to the Non-HIB group. (F) Heat map representation of relative mRNA expression change in the Insulin-Akt-mTORC1 signaling pathway and its downstream signaling pathways. ∗q < 0.05, ∗∗q < 0.01, ∗∗∗q < 0.005.

