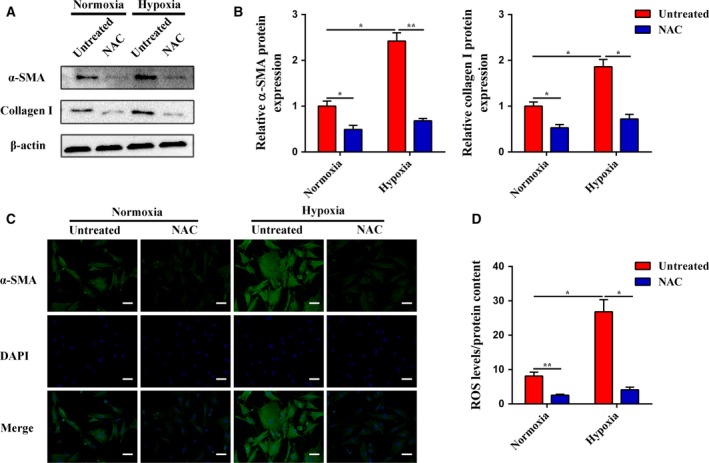
Figure 1.

Hypoxia‐driven PSC activation is ROS‐dependent. (A and B) Subconfluent PSCs were cultured in normoxia or hypoxia with or without NAC, and then, the protein expression levels of α‐SMA and collagen I were determined by western blot analysis. β‐Actin was used as an internal control. (C) PSCs were treated as in (A), and the α‐SMA expression was analyzed by immunofluorescence staining. The green signal represents α‐SMA staining, and nuclear DNA staining by DAPI is shown in blue. The scale bar represents 50 μm. (D) PSCs were treated as in (A), and the ROS production was evaluated by DCFH‐DA and normalized based on the total protein content. All data are shown as the mean ± SD of at least three independent experiments. One‐way ANOVA and Tukey's multiple comparisons test were performed to determine significance. *P < 0.05, **P < 0.01.
