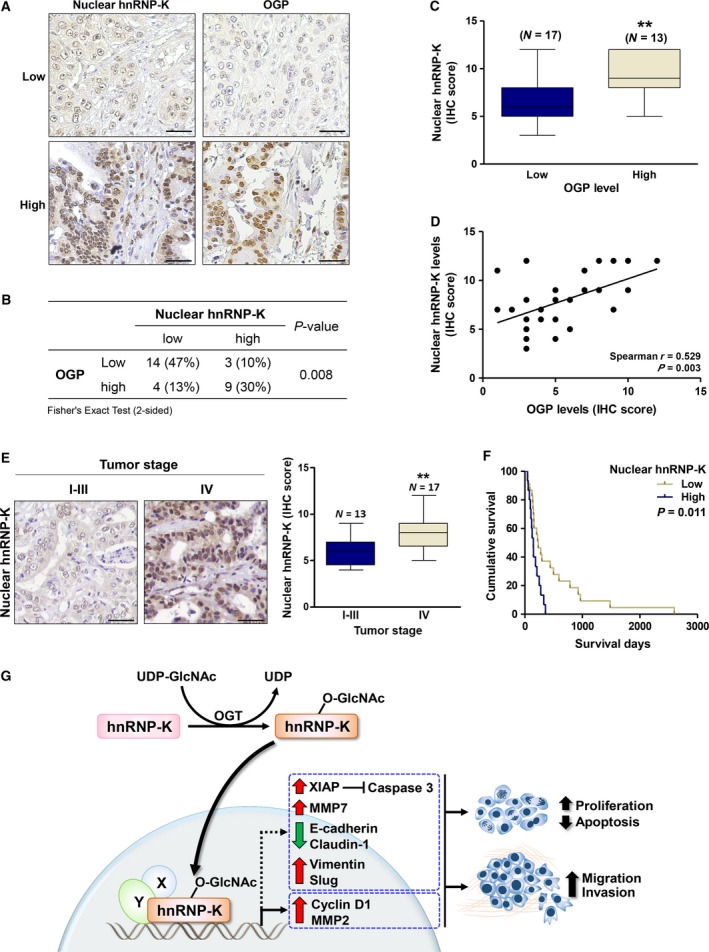
Figure 6.

The expression and localization of hnRNP‐K in CCA tissues correlated with OGP levels. (A) IHC staining of hnRNP‐K and OGP in two representative pairs of CCA tissues. (B) The correlations between hnRNP‐K expression and OGP were analyzed by Fisher's exact test (N = 30). (C) Mean expression of hnRNP‐K in nucleus of the high OGP group was significantly higher than those of the low OGP group (**P < 0.01; Mann–Whitney test). (D) The positive correlation between nuclear hnRNP‐K and OGP levels was shown by Spearman's rank correlation test. (E) Nuclear hnRNP‐K in CCA patient tissues with stage I‐III and IV were compared. (F) High level of nuclear hnRNP‐K was correlated with shorter CCA patients with high nuclear hnRNP‐K level exhibited the shorter survival (median survival = 147 days, 95% CI = 106–187 days), than those with low nuclear hnRNP‐K level (median survival = 233 days, 95% CI = 128‐338 days) (P = 0.011, Kaplan–Meier plot and log‐rank test). The IHC images are showed in 200 × magnification with 20 μm of scale bar. (G) Schematic diagram presents molecular mechanism by which O‐GlcNAcylation regulated nuclear translocation of hnRNP‐K in association with progression of CCA.
