Figure 4.

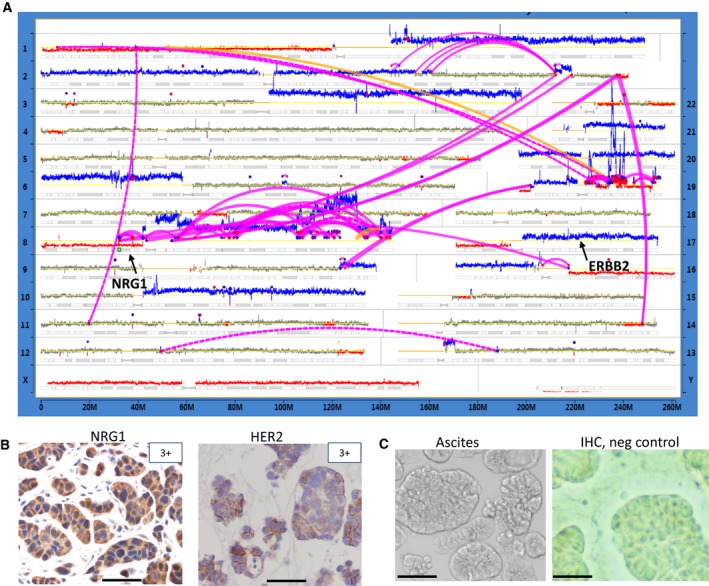
Genomic characterization of PH212 patient's tumor. (A) A genome plot showing a landscape of structural alterations in original patient's tumor. Designations are as in Fig. 1B,C. Location of NRG1 and ERBB2 genes is indicated. (B) Immunostaining showing levels (corresponding to strongly positive) of NRG1 and HER2 proteins in original patient's PH212 tumor. (C) Transmitted light image (left) and IHC image (with primary antibody omitted) of ascites (right). Scale bars: 50 μm.
