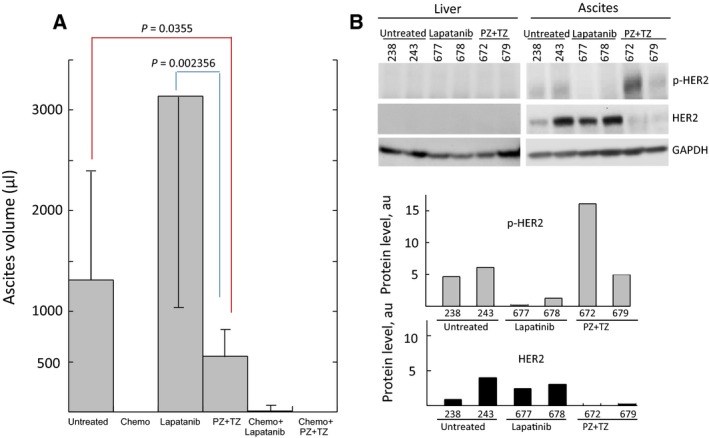
Figure 5.

Treatment responses in ascites of PH212 model. (A) Ascites volume changes in response to targeted therapy compared with those in untreated and treated mice with chemotherapy or chemo‐ and targeted therapy combination. Volumes are expressed as mean ± SD. Student's t‐test was used to compare the differences. (B) The protein levels of HER2 and p‐HER2 in ascites of untreated and treated (as indicated) mice determined by immunoblotting. Quantification of protein levels normalized to GAPDH level is shown at the bottom.
