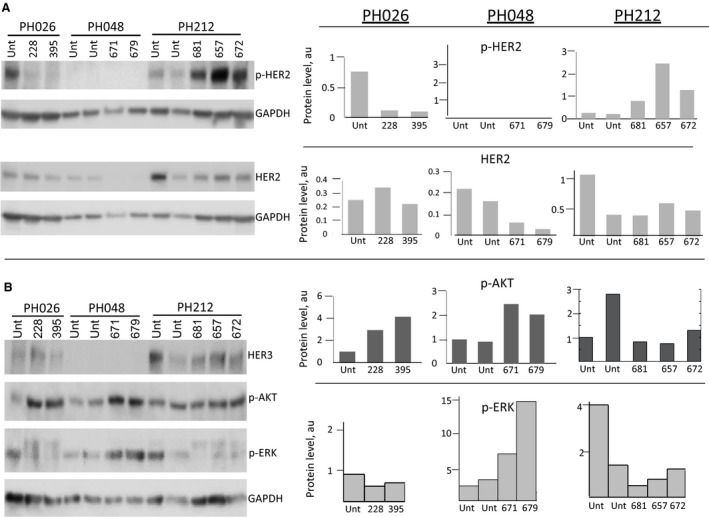
Figure 6.

Comparison of molecular changes of ERBB pathway upon anti‐HER2 treatment in three PDX models. (A) Immunoblotting showing levels of HER2 and phospho‐HER2 of three PDX models. Quantification of protein levels, normalized to GAPDH level, is shown on the right. Unt, untreated. (B) Immunoblotting analysis of activated downstream protein targets of ERBB2 pathway. Quantification of protein levels, normalized to GAPDH level, is shown on the right.
