
Figure 1.
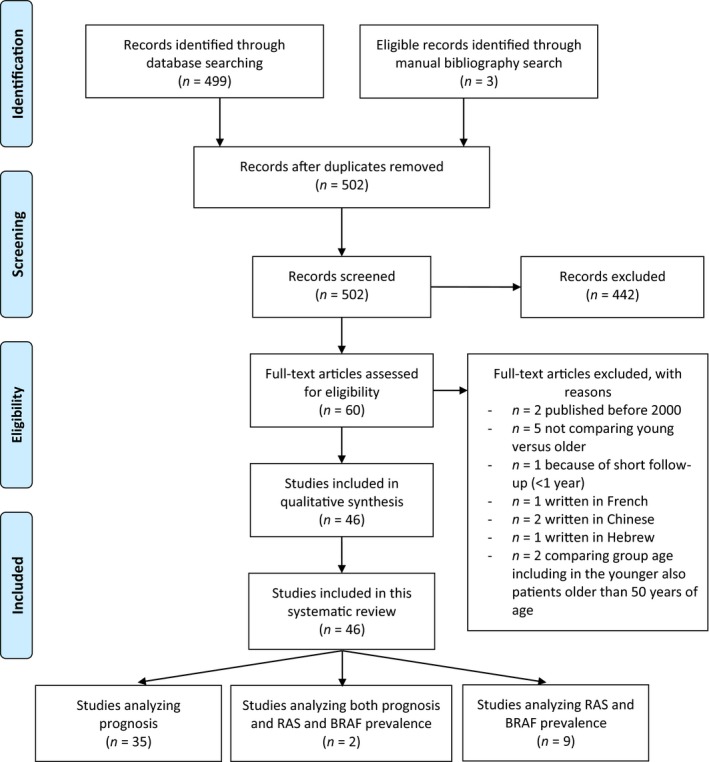
PRISMA 2009 flow diagram depicting the systematic review process performed to retrieve articles on prognosis and RAS and BRAF prevalence among EO‐CRC.
Official websites use .gov
A
.gov website belongs to an official
government organization in the United States.
Secure .gov websites use HTTPS
A lock (
) or https:// means you've safely
connected to the .gov website. Share sensitive
information only on official, secure websites.
PRISMA 2009 flow diagram depicting the systematic review process performed to retrieve articles on prognosis and RAS and BRAF prevalence among EO‐CRC.