
Figure 2.
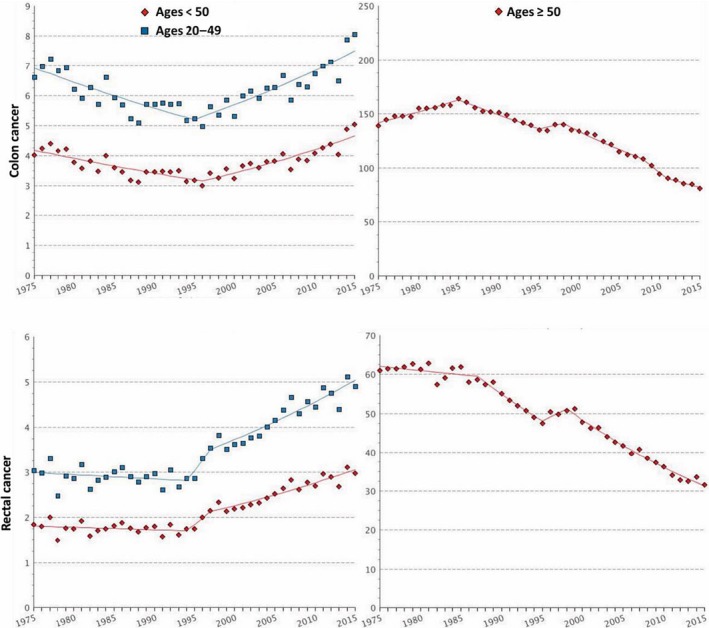
Graphs report age‐adjusted SEER (Surveillance, Epidemiology and End Results) incidence rates of colon (upper panels) and rectal (lower panels) cancer from 1975 to 2015 among individuals younger (left panels) and older (right panels) than 50 years. On the Y‐axis is reported incidence rate per 100 000 and on the X‐axis is reported the year of diagnosis. Data were plotted by accessing SEER website at the weblink https://seer.cancer.gov/faststats/selections.php?series=cancer