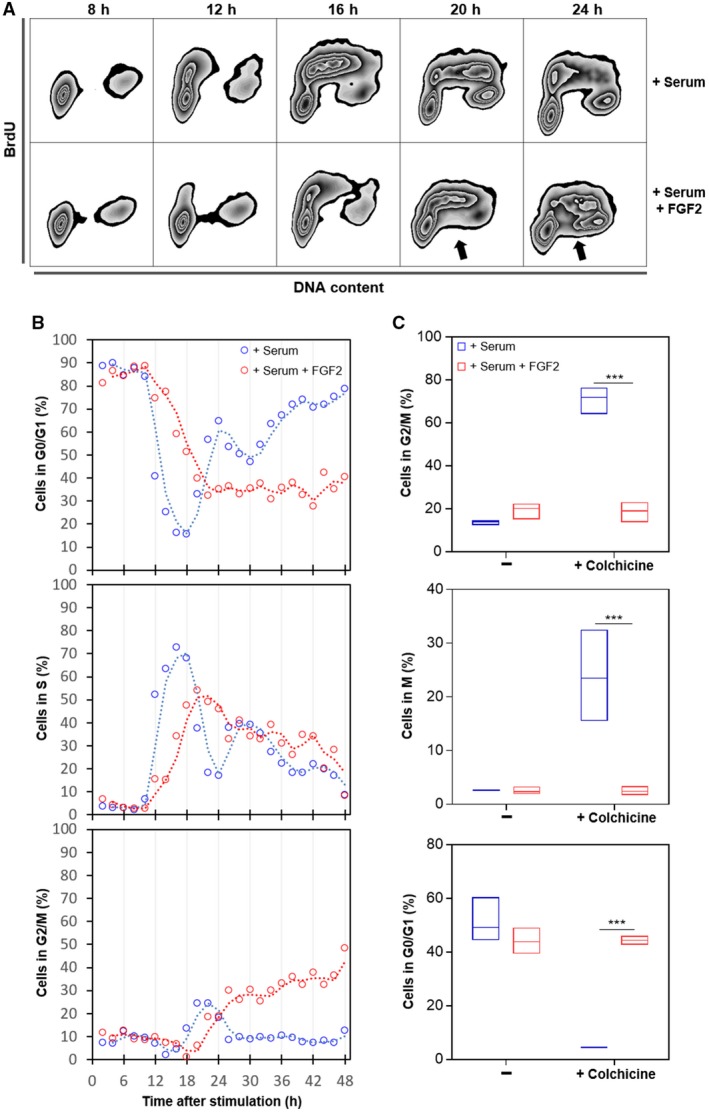
Figure 1.

FGF2 impairs cell cycle progression in K‐Ras‐driven cancer cells. Serum‐starved Y1D1 cells were stimulated by 10% serum with or without 10 ng·mL−1 FGF2 to re‐entry the cell cycle. Cells were subjected to a BrdU pulse 30 min before sample collection (every two hours). (A) Representative zebra plot flow cytometry data of BrdU‐stained cells versus DNA content at the indicated times after stimulation comparing cell cycle re‐entry and progression with or without FGF2. BrdU was added at 50 μm for 30 min before harvesting. The arrows indicate BrdU‐unlabeled S‐phase cells. (B) Time‐course flow cytometry analyses comparing the progression along cell cycle phases from 2 to 48 h after stimulation by serum with or without FGF2. BrdU was added at 50 μm for 30 min before harvesting. (C) Quantifications of flow cytometry data showing phospho‐histone H3 (S10) and DNA content double stain. The proportions of cells in each phase were measured 24, 28, 32, and 36 h after stimulation with serum or serum + FGF2 in presence or absence of 2 μm colchicine. Mitotic cells were addressed by chromatin condensation indicated by phospho‐histone H3 (S10)‐positive stain. Asterisks indicate significant differences. ***P ≤ 0.001 (one‐way ANOVA of variance followed by multiple comparison post‐test) (n = 4).
