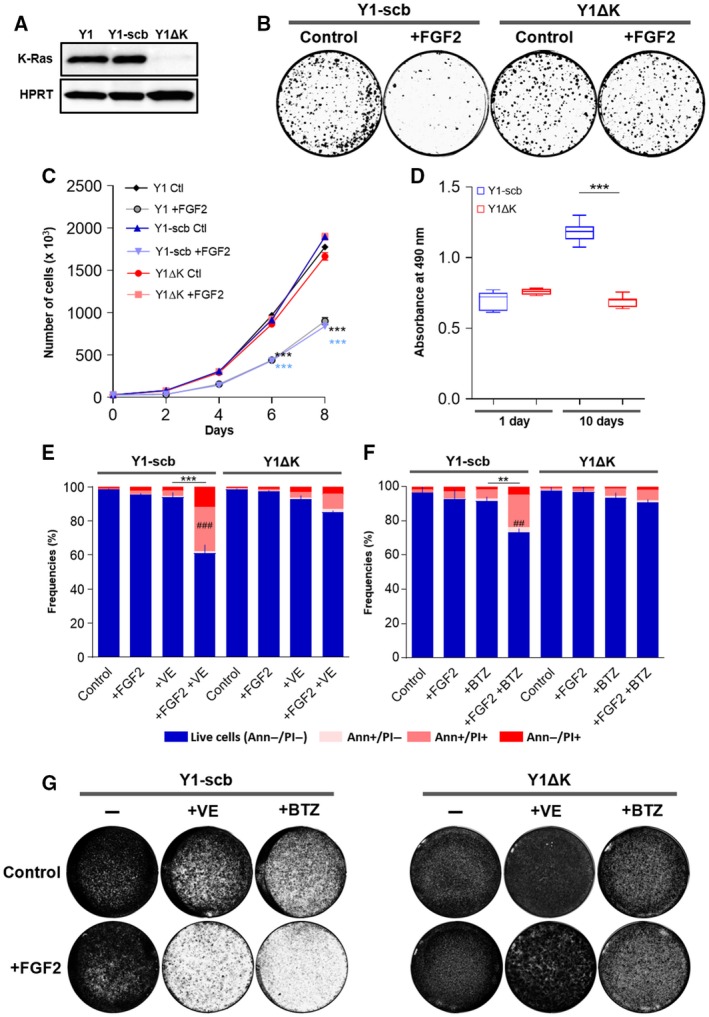
Figure 4.

K‐Ras overexpression is required for FGF2 toxicity and sensitization to cell death induced by checkpoint or proteasome inhibition. (A) Western blots comparing the levels of K‐Ras among Y1 parental, Y1‐scb control, and Y1ΔK K‐Ras‐depleted cells. Lysates were prepared from cells growing at complete media. HPRT was used as a loading control. (B) Representative clonogenic assays comparing the viability of Y1‐scb and Y1 ΔK cells. For each cell line, 100 cells·cm−2 were plated in complete media in presence or absence of 10 ng·mL−1 FGF2, grown for 15 days, and then fixed/stained. Culture media and FGF2 were renewed every 2 or 3 days. (C) Representative growth curves comparing the proliferation of Y1 parental, Y1‐scb control, and Y1 ΔK K‐Ras‐depleted cells. For each cell line, 3 × 10⁴ cells were plated in complete media in presence or absence of 10 ng·mL−1 FGF2 and grown for the indicated times. Culture media and FGF2 of the reminiscent plates were renewed at every harvest point. Error bars indicate mean ± SD of technical triplicates. Asterisks indicate significant differences from Y1 control condition. ***P ≤ 0.001 (two‐way ANOVA of variance followed by multiple comparison post‐test). (D) Nonadherent proliferation assay comparing Y1‐scb and Y1 ΔK cells. For each cell line, 1 × 10⁴ cells were plated on ultra‐low attachment 96‐well plates in complete media. Relative cell viability/proliferation was addressed after 1 day, to set up a baseline, and after 10 days to measure proliferation using CellTiter 96 AQ ueous (Promega). At least eight wells per cell were assayed at each time point. Asterisks indicate significant differences. ***P ≤ 0.001 (one‐way ANOVA of variance followed by multiple comparison post‐test). (E) Flow cytometry data of Y1‐scb control, and Y1 ΔK K‐Ras‐depleted cells growing in complete media in presence or absence of 10 ng·mL−1 FGF2 for 48 h, with concomitant addition of 5 μm VE‐821 (VE). (F) Flow cytometry data of Y1‐scb control and Y1 ΔK K‐Ras‐depleted cells growing in complete media in presence or absence of 10 ng·mL−1 FGF2 for 96 h, with the addition of 20 nm bortezomib (BTZ) in the last 72 h. For (E) and (F), Annexin V/PI double stain was used to address cell death. Error bars indicate mean ± SD of live cells (n = 3, from independent experiments). Asterisks indicate statistically significant differences. **P < 0.01 and ***P ≤ 0.001 (one‐way ANOVA of variance followed by multiple comparison post‐test). #Significant differences from the FGF2‐treated sample.###P ≤ 0.001 (G) Representative assays comparing the long‐term viability of Y1‐scb and Y1 ΔK cells treated with the combinations of FGF2 and VE‐821 or bortezomib. For each cell line, 2.5 × 10⁵ cells were plated and treated as described in (E) and (F). After the treatments, the stimuli were washed out, the plates were grown in complete media for additional 10 days, and then fixed/stained.
