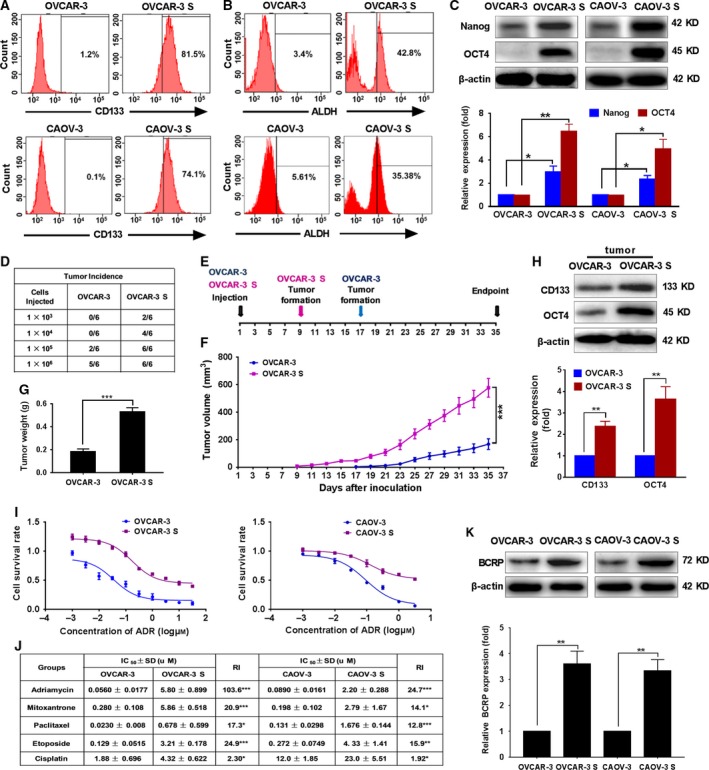
Figure 1.

OVCAR‐3 S and CAOV‐3 S cells possess OCSC‐like properties, are resistant to ADR, and overexpress the CSC marker, BCRP. (A) Representative images indicating the percentage of CD133‐positive cells in OVCAR‐3 vs. OVCAR‐3 S cells and CAOV‐3 vs. CAOV‐3 S cells as determined by flow cytometry. (B) Representative images of the percentage of ALDH‐positive cells in OVCAR‐3 vs. OVCAR‐3 S cells and CAOV‐3 vs. CAOV‐3 S cells by flow cytometry. (C) The expression levels of Nanog and OCT4 were measured by western blot analysis. β‐actin was used as a loading control. The expression level of Nanog or OCT4 was normalized to that of β‐actin. The Nanog or OCT4 expression level in OVCAR‐3 or CAOV‐3 cells was set as 1. Data are presented as mean ± SD from three independent experiments. *P < 0.05, **P < 0.01. (D) Tumor incidence in female BALB/c athymic nude mice at 5 weeks after subcutaneous injection with the indicated number of OVCAR‐3 and OVCAR‐3 S cells in vivo (n = 6 per group). (E) A diagram showing the time of tumor formation in the BALB/c mice transplanted with the OVCAR‐3 S cells or OVCAR‐3 cells (1 × 10⁶). (F) Tumor volumes were calculated as described in the Methods (n = 5 per group). ***P < 0.001. (G) The weight of tumors induced by inoculation of OVCAR‐3 and OVCAR‐3 S cells after mice were sacrificed 35 days after cell inoculation (n = 5 per group). (H) The expression of CD133 and OCT4 in tumors transplanted with OVCAR‐3 S cells or OVCAR‐3 cells was determined by western blot analysis. β‐actin was used as a loading control. The expression level of CD133 or OCT4 was normalized to that of β‐actin. The CD133 or OCT4 expression level in OVCAR‐3 cells was set as 1. Data are presented as mean ± SD from three independent experiments. **P < 0.01. (I) Cell survival rate was analyzed by CCK‐8 assays 48 h after OVCAR‐3/OVCAR‐3 S and CAOV‐3/CAOV‐3 S cells were treated with different concentrations of ADR. (J) The comparison of IC 50 and resistant index (RI) values of ADR, MX, PTX, VP‐16, and DDP in OVCAR‐3 vs. OVCAR‐3 S cells and CAOV‐3 vs. CAOV‐3 S cells. Data are presented as mean ± SD from three independent experiments. *P < 0.05, **P < 0.01, ***P < 0.001. (K) The protein expression levels of BCRP were analyzed by western blot in OVCAR‐3 S and CAOV‐3 S cells versus their parental cells. β‐actin was used as a loading control. The expression level of BCRP was normalized to that of β‐actin. The BCRP expression level in OVCAR‐3 cells or CAOV‐3 cells was set as 1. Data are presented as mean ± SD from three independent experiments. **P < 0.01. Statistical significance was evaluated by Student's t‐test.
