Figure 3.

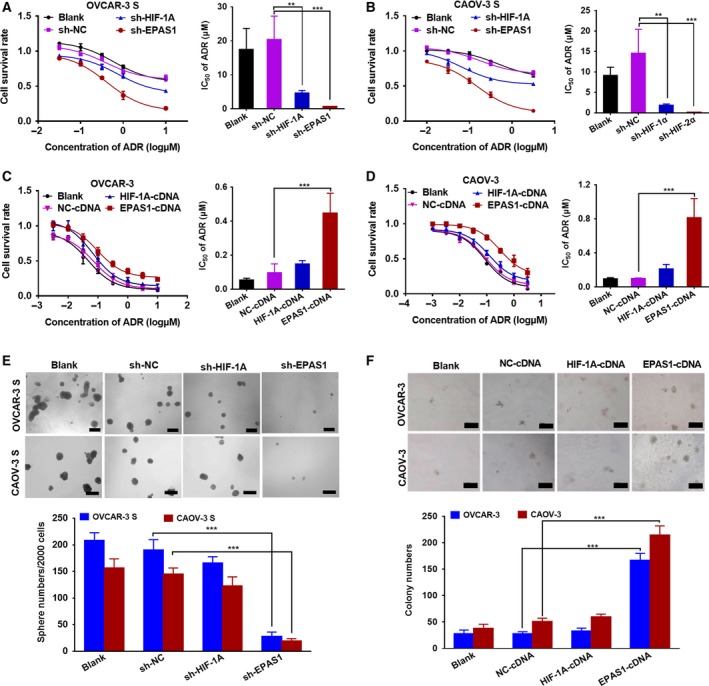
The influences altered expression levels of HIF‐2α on the sensitivity of OCSCs to ADR. Cell survival rate was analyzed by CCK‐8 assays and the comparison of IC 50 values 48 h after (A) OVCAR‐3 S and (B) CAOV‐3 S cells transduced with sh‐HIF‐1A, sh‐EPAS1, or negative control (sh‐NC) lentivirus and treated with different concentrations of ADR under hypoxic conditions (1% O2) for 48 h. Data are presented as the mean ± SD from three independent experiments. **P < 0.01, ***P < 0.001. Cell survival rate was analyzed by MTT assays and the comparison of IC 50 values 48 h after (C) OVCAR‐3 and (D) CAOV‐3 cells were transduced with HIF‐1A‐cDNA,EPAS1‐cDNA, or NC‐cDNA lentivirus and treated with different concentrations of ADR. Data are presented as the mean ± SD from three independent experiments. ***P < 0.001. (E) Sphere formation assays were carried out in OVCAR‐3 S and CAOV‐3 S cells transduced with sh‐HIF‐1A, sh‐EPAS1, or sh‐NC lentivirus. The length of the scale bars is 200 μm. (F) Soft agar colony formation assays were done in the OVCAR‐3 and CAOV‐3 cells transduced with HIF‐1A‐cDNA,EPAS1‐cDNA, or NC‐cDNA lentivirus. The length of the scale bars is 50 μm. Data are presented as the mean ± SD from three independent experiments. *** P < 0.001. Statistical significance was evaluated by Student's t‐test.
