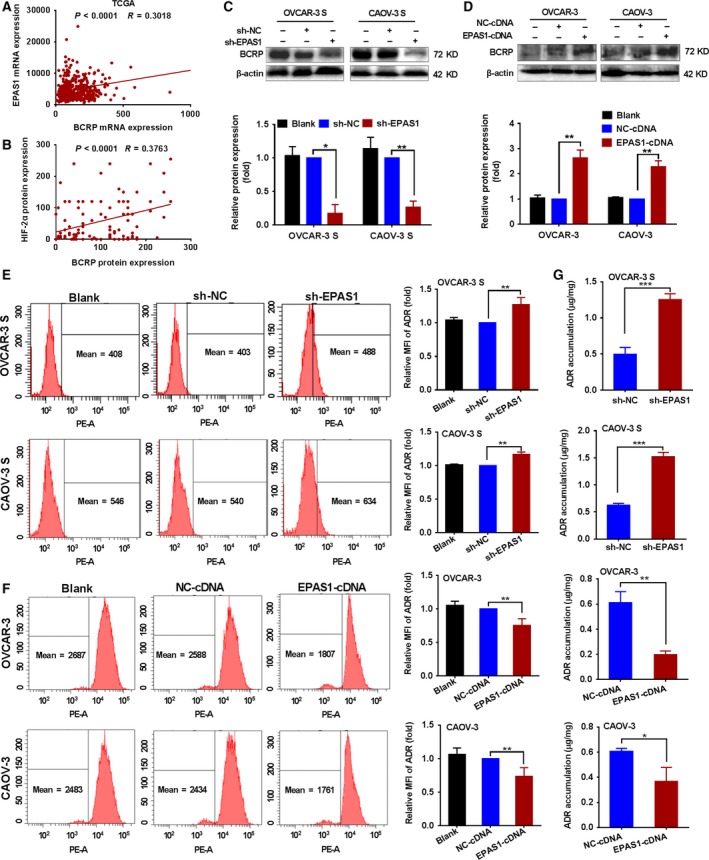
Figure 4.

The effects of HIF‐2α on the expression of the BCRP protein and the transport function of BCRP for ADR in OCSCs. (A) TCGA data were used to analyze the relationship between mRNA expression of EPAS1 and BCRP in 379 ovarian cancer cases by linear regression analysis. (B) Correlation between protein expression of HIF‐2α and BCRP in 115 ovarian cancer tissues was analyzed by linear regression analysis. (C) The protein expression of BCRP was analyzed by western blot in OVCAR‐3 S and CAOV‐3 S cells transduced with sh‐EPAS1 or sh‐NC lentivirus under hypoxic conditions (1% O2) for 48 h and (D) in the OVCAR‐3 and CAOV‐3 cells transduced with EPAS1‐cDNA or NC‐cDNA lentivirus. β‐actin was a used an endogenous control. BCRP expression levels in the OVCAR‐3 S cells and CAOV‐3 S cells transduced with sh‐NC lentivirus and OVCAR‐3 cells and CAOV‐3 cells transduced with NC‐cDNA were set as 1. Data are presented as the mean ± SD from three independent experiments. *P < 0.05, **P < 0.01. (E) Changes in the intracellular accumulation of ADR were determined by flow cytometric analysis in OVCAR‐3 S and CAOV‐3 S cells transduced with sh‐ EPAS1 or sh‐NC lentivirus under hypoxic conditions (1% O2) for 48 h, and (F) in the OVCAR‐3 cells or CAOV‐3 cells transduced with EPAS1‐cDNA or NC‐cDNA lentivirus. The MFI of the intracellular accumulation of ADR in OVCAR‐3 S cells or CAOV‐3 S cells transduced with sh‐NC lentivirus and in OVCAR‐3 cells or CAOV‐3 cells transduced with NC‐cDNA was set as 1. Data are presented as mean ± SD from three independent experiments. **P < 0.01. (G) Changes in intracellular accumulation of ADR in EPAS1‐silenced OVCAR‐3 S and CAOV‐3 S cells and (H) EPAS1‐overexpressing OVCAR‐3 and CAOV‐3 cells were analyzed by mass spectrometry. Data are presented as the mean ± SD from three independent experiments. *P < 0.05, **P < 0.01, ***P < 0.001. Statistical significance was evaluated by Student's t‐test.
