Figure 1.

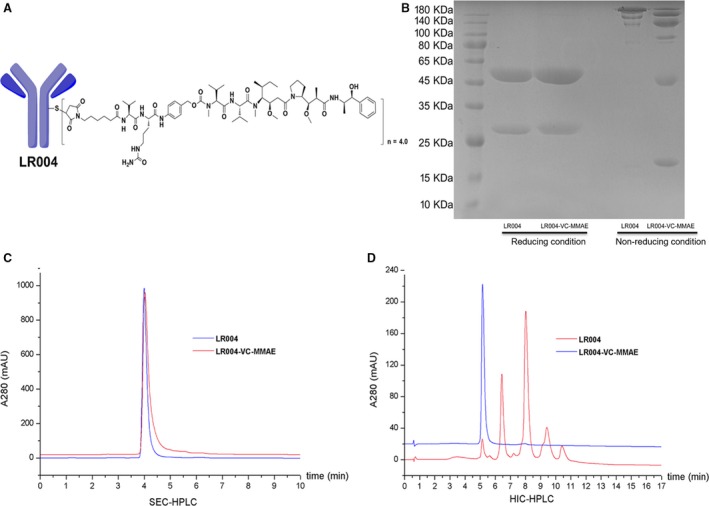
Characterization of LR004 and LR004‐VC‐MMAE. (A) The structure of LR004‐VC‐MMAE. (B) SDS/PAGE analysis of LR004 and LR004‐VC‐MMAE under the reducing and nonreducing conditions (gradient 4–12%). (C) SEC‐HPLC analysis of LR004 and LR004‐VC‐MMAE. LR004, RT (retention time) = 3.998 s; LR004‐VC‐MMAE, RT (retention time) = 4.031 s. (D) HIC analysis of LR004 and LR004‐VC‐MMAE. The HIC‐HPLC spectrum of LR004‐VC‐MMAE displays five major peaks, corresponding to zero, two, four, six, and eight drugs per antibody. The average DAR of LR004‐VC‐MMAE is approximately 4.0 after integration of the observed peaks.
