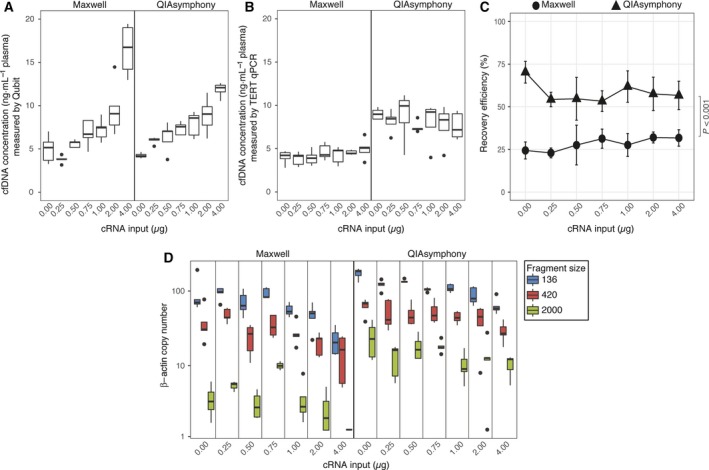
Figure 1.

Effect of increasing cRNA input (0–4 μg) on cfDNA quantity and quality using the Maxwell and QIAsymphony platforms. The effect on cfDNA concentration (ng·mL −1 plasma) was measured by Qubit (A) and TERT qPCR (B). The recovery efficiency of each platform was analyzed by qPCR using spiked‐in synthetic plant DNA (C). Differences in cfDNA fragment size, expressed as number of β‐actin fragments for each fragment size (136, 420 and 2000 bp), were analyzed by dPCR (D). Boxes (interquartile ranges; IQR) and whiskers (1.5× IQR) are shown together with the median (black horizontal line). Outliers are indicated as single black points. Symbols ● and ▲ are mean values shown with whiskers (standard deviation). The Friedman test was used to test the group difference between Maxwell and QIAsymphony samples. Significant differences were post hoc analyzed using the Wilcoxon signed‐rank test. N = 5.
