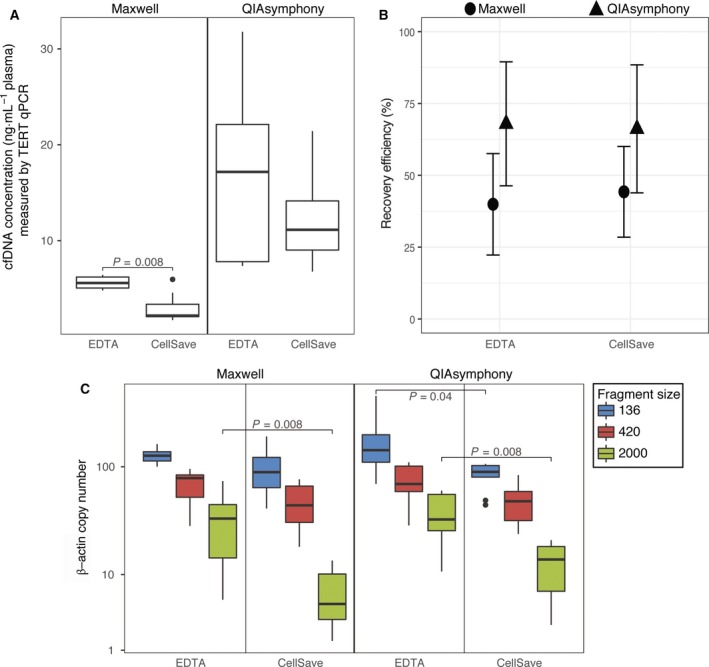
Figure 2.

Compatibility of EDTA and CellSave blood collection tubes with the Maxwell and QIAsymphony platforms. The effects on cfDNA concentration (ng·mL −1 plasma) measured by TERT qPCR (A), recovery efficiency measured by plant DNA qPCR (B), and β‐actin fragmentation assay analyzed with dPCR are shown (C). Boxes (interquartile ranges; IQR) and whiskers (1.5× IQR) are shown together with the median (black horizontal line). Outliers are indicated as single black points. Symbols ● and ▲ are mean values shown with whiskers (standard deviation). The Wilcoxon signed‐rank test was used to test the difference between blood collection tubes for each platform. N = 9.
