Figure 1.

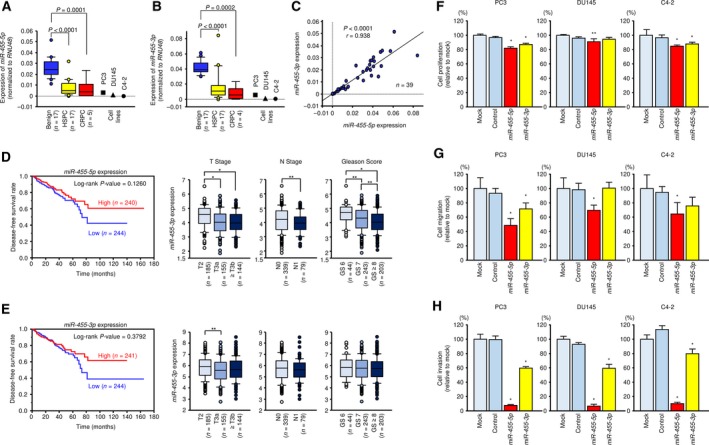
Expression of miR‐455‐5p/‐3p in clinical PCa specimens and functional analysis of miR‐455‐5p/‐3p in PCa cell lines. Expression levels of (A) miR‐455‐5p and (B) miR‐455‐3p in PCa clinical specimens and cell lines determined using qRT‐PCR. RNU48 was used as an internal control. P‐values were calculated using Bonferroni‐adjusted Mann–Whitney U‐test. (C) Correlations between the relative expression levels of miR‐455‐5p and miR‐455‐3p analyzed by using Spearman's rank test. (D) Kaplan–Meier patient survival curves for DFS rates based on miR‐455‐5p expression (left) and relationships between miR‐455‐5p expression and T stage, N stage, and Gleason score (right) in PCa patients from the TCGA database. (E) Kaplan–Meier patient survival curves for DFS rates based on miR‐455‐3p expression (left) and relationships between expression of miR‐455‐3p and T stage, N stage, and Gleason score (right). *P < 0.0001 and **P < 0.05. P‐values were calculated using Mann–Whitney U‐test or Bonferroni‐adjusted Mann–Whitney U‐test. (F–H) Cell proliferation, migration, and invasion assays in cells transfected with miR‐455‐5p/‐3p. Error bars are represented as mean ± SD (n = 5, n = 8, and n = 8, respectively). *P < 0.0001 and **P < 0.05, relative to both mock and control. P‐values were calculated using Bonferroni‐adjusted Mann–Whitney U‐test.
