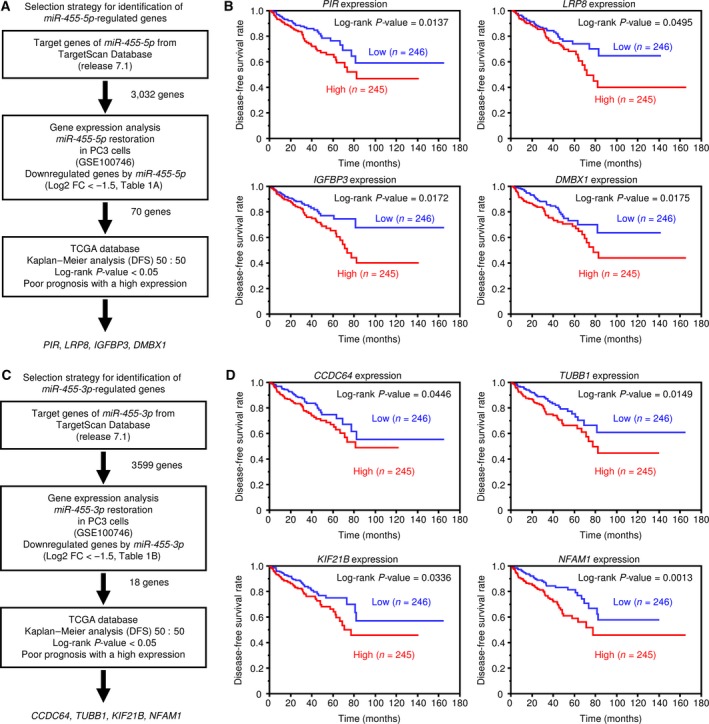
Figure 2.

Identification of miR‐455‐5p/‐3p target genes and relationship between putative target genes and DFS rates. (A) Flowchart of the strategy used to identify miR‐455‐5p target genes. (B) Kaplan–Meier patient survival curves for DFS rates based on PIR, LRP8, IGFBP3, and DMBX1 expression in PCa patients from the TCGA database. (C) Flowchart of the strategy to identify miR‐455‐3p target genes. (D) Kaplan–Meier patient survival curves for DFS rates based on CDC64, TUBB1, KIF21B, and NFAM1 expression.
