
Figure 5.
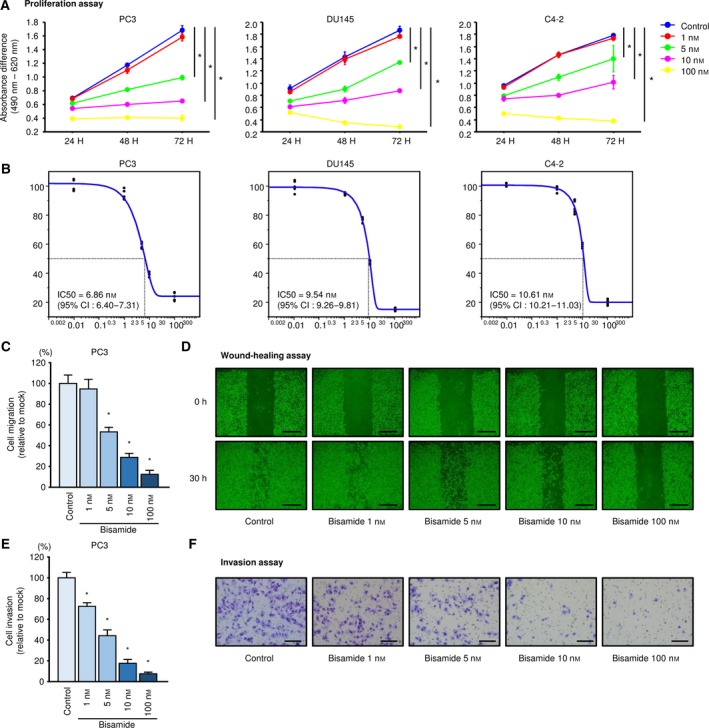
Effects of the small‐molecule PIR inhibitor bisamide (CCT251236) on PCa proliferation, migration, and invasion. (A) Proliferation curves over time according to the results of XTT assays following bisamide treatment in PC3, DU145, and C4‐2 were generated using the absorbance difference between 490 and 620 nm. Error bars are represented as mean ± SD (n = 5). *P < 0.0001, relative to control at 72 h. P‐values were calculated using Bonferroni‐adjusted Mann–Whitney U‐test. (B) Dose‐dependent curves of bisamide on cell proliferation at 72 h in PC3, DU145, and C4‐2. The IC50 was calculated using jmp software. (C) Cell migration assays using bisamide in PC3. Error bars are represented as mean ± SD (n = 8). *P < 0.0001, relative to control. P‐values were calculated using Bonferroni‐adjusted Mann–Whitney U‐test. (D) Phase micrographs of wound‐healing assays using bisamide in PC3. Scale bars represent 500 μm. (E) Cell invasion assays using bisamide in PC3. Error bars are represented as mean ± SD (n = 8). *P < 0.0001, relative to control. P‐values were calculated using Bonferroni‐adjusted Mann–Whitney U‐test. (F) Phase micrographs of invasion assays using bisamide in PC3. Scale bars represent 200 μm.