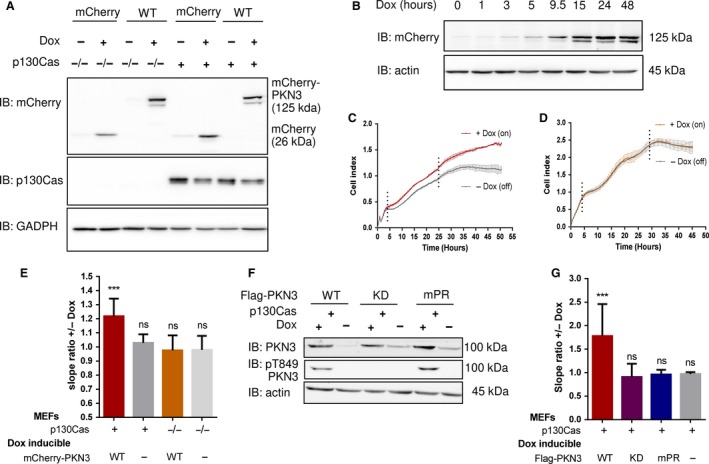
Figure 5.

PKN3 overexpression regulates growth of MEFs, and this effect requires PKN3–p130Cas interaction. (A) Immunoblotted lysates from MEFs p130Cas−/− or MEFs p130Cas−/− re‐expressing p130Cas (p130Cas+) treated by Doxycycline (Dox) to induce expression of mCherry‐PKN3 or mCherry alone. p130Cas presence was detected by ani‐p130Cas antibody and mCherry epitope by anti‐mCherry antibody. (B) Dynamics of mCherry‐PKN3 expression after supplementation with Dox shown by immunoblot with anti‐mCherry antibody. (C–E) Effect of induced mCherry‐PKN3 expression on cell growth. Representative graphs showing growth of MEFs p130Cas−/− re‐expressing p130Cas (p130Cas+) (C) or MEFs p130Cas−/− (D) measured in real‐time using the xCELLigence RTCA (real‐time cell analysis) system instrument. (E) Quantification of cell growth change induced by mCherry‐PKN3 expression (‘−’ indicates inducible mCherry expression used as negative control). Slope ratios reflecting cell growth were calculated from the log growth phase of cell growth (indicated by dotted lines; see C and D). (F) Immunoblotted lysates from MEFs p130Cas−/− re‐expressing p130Cas (p130Cas+) treated or not treated by Dox which induced expression of Flag‐fused PKN3 variants (WT, mPR, KD, empty vector). Stimulated overexpression of PKN3 was detected by anti‐PKN3 antibody and its activity by antibody anti‐pT849 PKN3. (G) Quantification of cell growth change stimulated by Dox‐inducible expression of Flag‐fused PKN3 variants (WT, mPR, KD) in MEFs p130Cas−/− re‐expressing p130Cas (p130Cas+). All error bars indicate means ± SD calculated from 3 to 5 independent experiments (each in triplicates). Statistical significance was always calculated between induced and noninduced cells and evaluated by one‐way repeated ANOVA followed by Turkey post hoc test (***P < 0.001).
