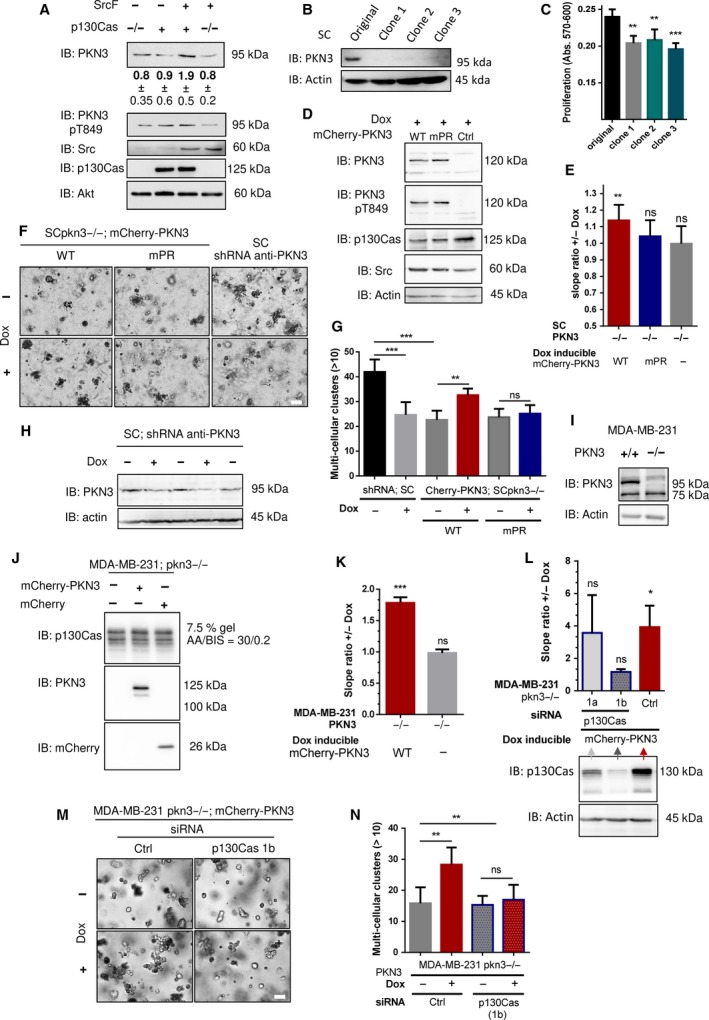
Figure 7.

PKN3 regulates growth in 2D and in 3D environment of Src‐transformed MEFs through interaction with p130Cas. (A) Immunoblot of MEFs p130Cas−/− re‐expressing p130Cas with or without transformation by constitutively active Src (SrcF, SC cells) and antibodies used as indicated (anti‐Akt served as loading control). Densitometric quantification of protein PKN3 amount is indicated below. (B) Immunoblot of SC cells and SC cells with PKN3 gene inactivated using CRISPR/CAS9 (SCpkn3−/−). Inactivation of PKN3 expression is visualized by antibody anti‐PKN3. Antibody anti‐actin was used as loading control. (C) Quantification of SC cells proliferation rate with or without inactivated PKN3 gene cassette by AlamarBlue method (72 h after cell seeding). The graph shows mean absorbance measurement at 570 nm with reference at 600 nm corrected for the initial deviations of cell seeding counts. (D) Immunoblotted lysates from SCpkn3−/− cells treated by Dox to induce expression of mCherry‐PKN3, mCherry‐PKN3 mPR, or mCherry alone. PKN3 constructs were detected by anti‐PKN3 and anti‐pT849 PKN3 antibodies, Src and p130Cas by antibodies as indicated. Antibody anti‐actin served as loading control. (E) Quantification of cell growth change induced by Dox‐inducible mCherry, mCherry‐PKN3 WT, or mCherry‐PKN3 mPR expression in SCpkn3−/− cells measured by xCELLigence RTCA system. Slope ratios reflecting cell growth were calculated from the log growth phase of cell growth (representative curves are shown in Fig. S7B). (F) SC and SCpkn3−/− cells stably expressing mCherry‐PKN3 WT, mPR, or shRNA anti‐PKN3 in Dox‐dependent manner were embedded into Matrigel. Photographs were taken on day 7, scale bar represents 100 μm; enlarged image for each sample is shown with subtracted background using imagej. (G) Multicellular clusters (> 10 cells) indicating proliferating cells were quantified relative to individual cells or small cell aggregates on day 7. Average mean is shown. (H–J) Immunoblots showing (H) effectiveness of PKN3 knockdown in SC cells, (I) MDA‐MB‐231 cells and MDA‐MB‐231 cells with PKN3 gene inactivated using CRISPR/CAS9 (MDApkn3−/−), and (J) engineered MDApkn3−/− cells treated by Dox to induce expression of mCherry‐PKN3 or mCherry alone. PKN3 expression is visualized by antibody anti‐PKN3. Antibody anti‐actin (p130Cas) was used as loading control. (K–N) Effect of induced PKN3 expression on MDApkn3−/− cell growth. (K, L) Quantification of cell growth change induced by Dox‐inducible mCherry‐PKN3 WT (mCherry alone) measured by xCELLigence RTCA system. Slope ratios reflecting cell growth were calculated from the log growth phase of cell growth (representative curves are shown in Fig. S5A,B). Cells in (L) were transfected by siRNA as indicated in this figure, 6–24 h before medium exchange +/− Dox. The effectiveness of p130Cas knockdown after 48 h is shown by immunoblot using anti‐p130Cas antibody. (M) Cells were transfected with siRNA as indicated and 24 h after embedded in 80% Matrigel ± Dox. Photographs taken on day 7, scale bar represents 100 μm. (N) Quantification for M) as described above in G). Error bars indicate means ± SD (C, E, G, N), ± SEM (K, L) calculated from 3 to 5 independent experiments (each in triplicates C, E; in duplicates G, L, N). Statistical significance comparing induced and noninduced cells (E, G, K, L, N) was evaluated by one‐way repeated ANOVA followed by Turkey post hoc test (*P < 0.05; **P < 0.01), among variants/groups (C, G, N) by one‐way ANOVA followed by Turkey post hoc test (**P < 0.01; ***P < 0.001).
