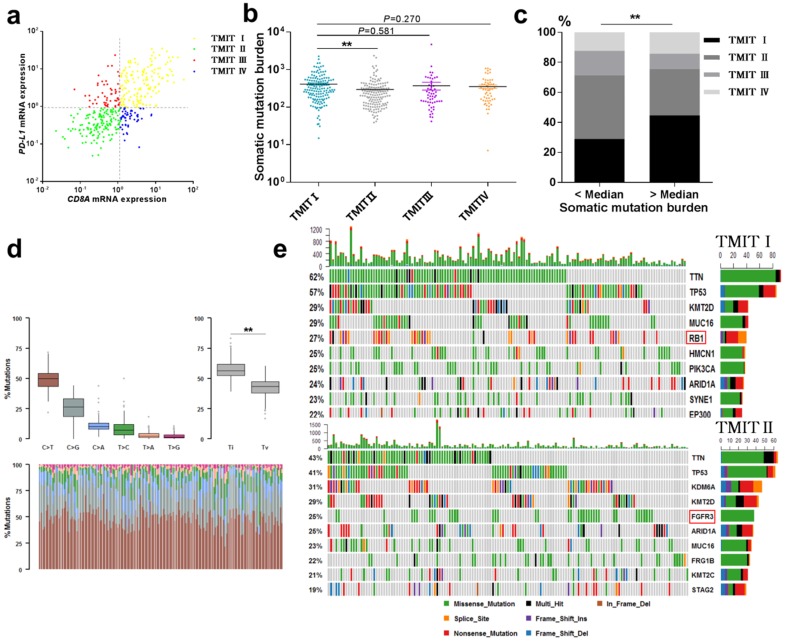
Fig 1.
Landscape of TMIT, mutational signatures and mutations. (a) Scatter plot for the distribution of TMITs. (b) Comparation of somatic mutation burden between different TMITs. (c) Comparation of the proportion of TMIT I according to somatic mutation burden. (d) Boxplot for classification of somatic variants in 150 TMIT I bladder tumors. (e) Alteration landscape for 150 TMIT I bladder tumors and 150 TMIT II bladder tumors. TMIT, tumor microenvironment immune type; Ti, transition; Tv, transversion; ***, P < 0.001; **, P < 0.01; *, P < 0.05.

