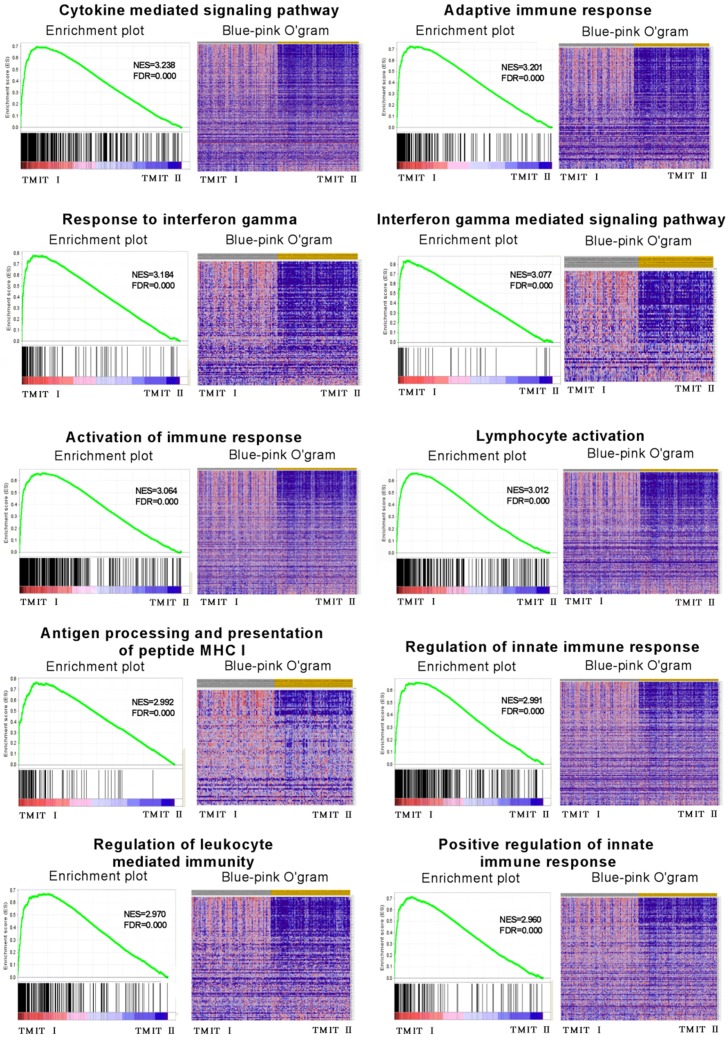
Fig 5.
GSEA revealed that TMIT I was significantly associated with some immune-related signaling pathway. The enrichment plot was used for providing a graphical view of the enrichment score for a gene set. The heatmap (Blue-Pink O' Gram) showed the expression of clustered-genes in the leading edge subsets, where the range of colors (red, pink, light blue, dark blue) showed the range of expression values (high, moderate, low, lowest). GSEA, gene set enrichment analysis; TMIT, tumor microenvironment immune type; NSE, normalized enrichment score; FDR, false discovery rate.

