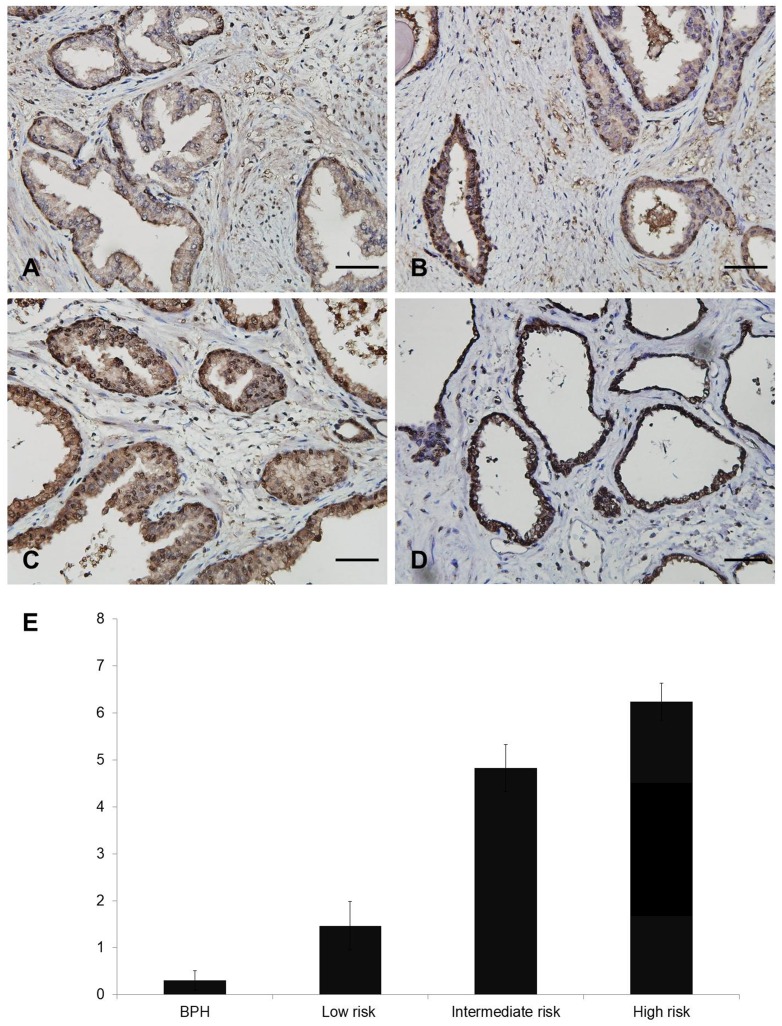
Figure 1.
Different nuclear staining of FOXM1 in human prostate tissue. A-D. Representative images of FOXM1 (Scale bar, 50 μm): A, Allred score 0 in BPH tissue. B, Allred score 5 in PCa tissue. C, Allred score 8 in PCa tissue. D, Allred score 8 in CRPC tissue. E. Quantitative analysis of nuclear expression of FOXM1 in BPH and PCa patients.

