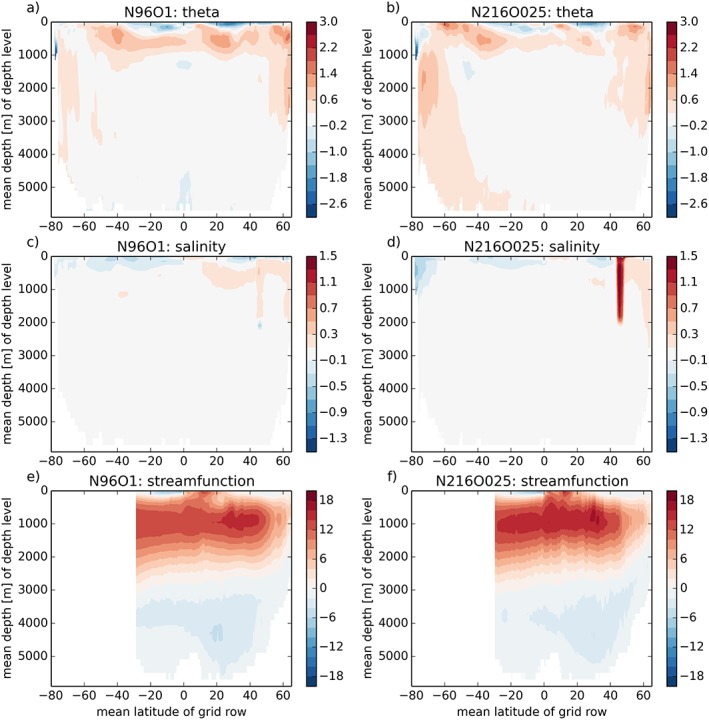
Figure 7.

Zonally averaged time‐mean bias (against EN4) of potential temperature (a, b; K) and salinity (c, d) for N96ORCA1 (left column) and N216ORCA025 (right column). Panels (e) and (f) show the overturning stream function (Sv) in the Atlantic basin.
