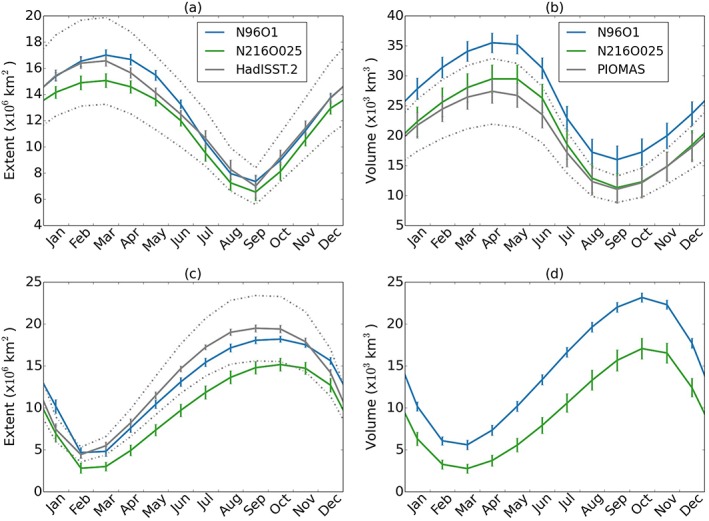
Figure 15.

Sea ice mean annual cycles for N96ORCA1 (blue) and N216ORCA025 (green). (a) Arctic ice extent, (b) Arctic ice volume, (c) Antarctic ice extent, and (d) Antarctic ice volume. In (a) to (c), the model data are assessed against observations (solid gray, with dashed lines for a ±20% envelope around the mean following Wang and Overland, 2012). The bars indicate ±1 standard deviation from variability on interannual and longer time scales. The observations are HadISST.2 for sea ice extent and PIOMAS (Schweiger et al., 2011) for Northern Hemisphere ice volume.
