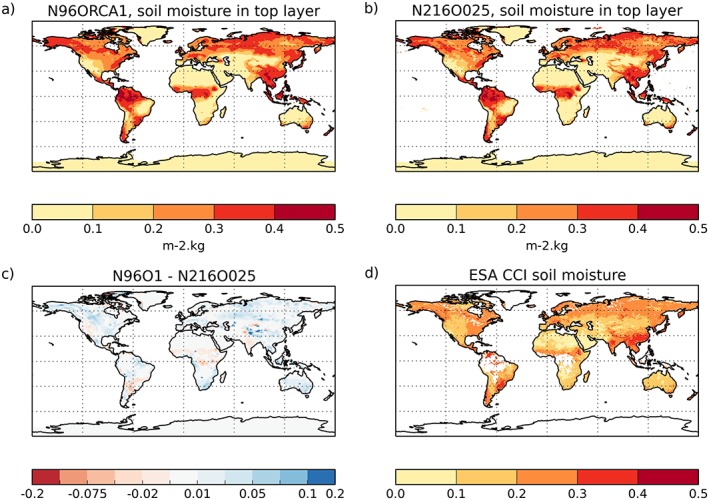
Figure 18.

Volumetric soil moisture (m3/m3) in the top soil layer of N96ORCA1 (a), N216ORCA025 (b; both 50‐year means), and in satellite observations (d; 20‐year mean). The difference between the two models is shown in (c). Shown are boreal summer means (June‐July‐August).
