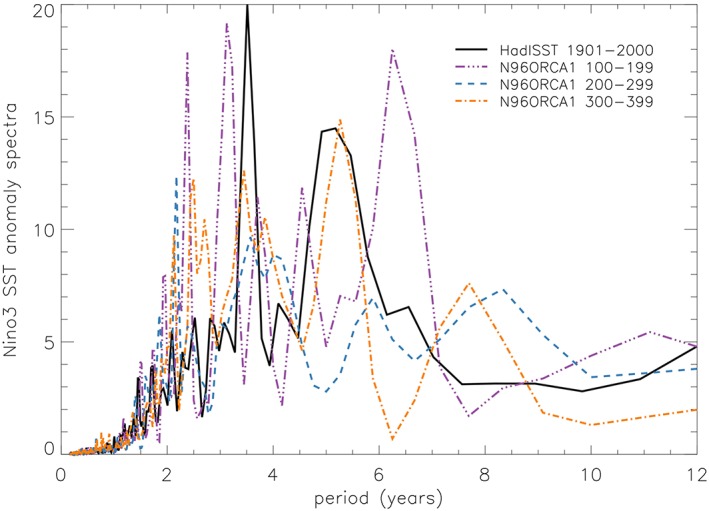
Figure 19.

Niño3 (90°–150°W, 5°N–5°S) SST anomaly power spectra for three consecutive 100‐year time slices of N96ORCA1 (purple, dash/triple dot; blue, dashed; and amber, dash‐dotted) and 100 years of observations (HadISST; black, solid). SST = sea surface temperature.
