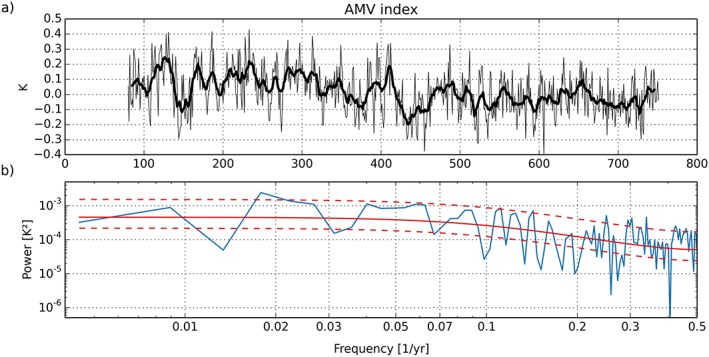
Figure 20.

(a) AMV index from years 80 to 752 of the N96ORCA1 present‐day control simulation. Annual means are plotted as a thin line, and the thick line shows an 11‐year running mean. (b) Power spectrum of the AMV index time series, calculated using a fast Fourier transform and a Bartlett window (blue). A theoretical AR(1) spectrum, diagnosed from the autocorrelation coefficient, is plotted in solid red. The dashed red lines show the 95% confidence interval around the AR(1) spectrum. AMV = Atlantic Multidecadal Variability.
