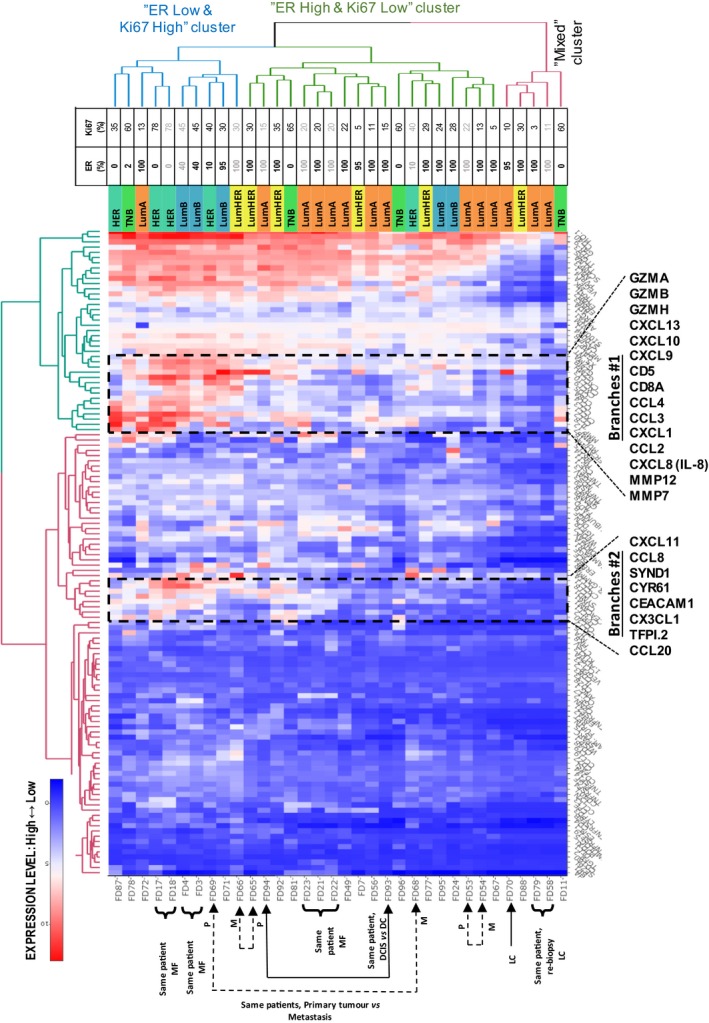
Figure 1.

Heatmaps of protein expression for the patient samples: Two‐dimensional hierarchical clustering of samples vs protein profiles. Proteins for which > 25% of the values were below LOD were excluded. Compare Fig. S1 which shows a very similar clustering of samples. Clustering of proteins and samples indicates correlations between subtypes and protein functions. A zoom‐in view of Branches #1 is shown in Fig. S2. An interactive representation providing data values can be explored at http://research.scilifelab.se/andrej_alexeyenko/downloads/PEA/heatmap.PEA.34x124.v10.html.
