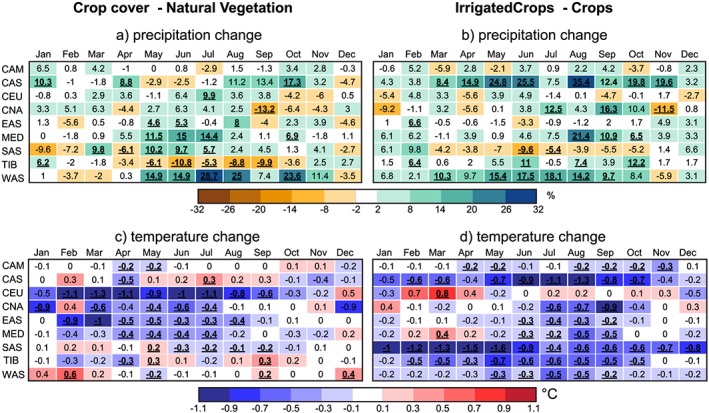
Figure 3.

Simulated changes in monthly, area‐average (a, b) precipitation and (c, d) surface temperature in the agricultural land cover change experiment (Crops) relative to the natural vegetation experiment (NatVeg) and the agricultural land cover change with added irrigation experiment (Irrigated Crops) relative to Crops. Refer to Figure 1 for regions. Changes that are underlined and in bold are significant at the 10% level.
