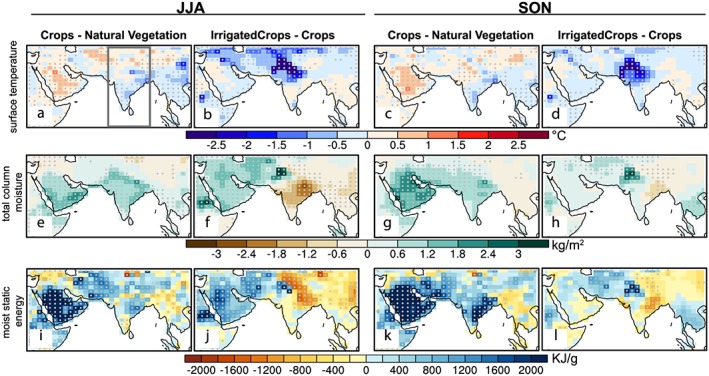
Figure 10.

Simulated changes in seasonal (a–d) surface temperature, (e–h) total column moisture, and (i–l) moist static energy in the agricultural land cover change experiment relative to the natural vegetation experiment (Crops – Natural Vegetation) and the agricultural land cover change with added irrigation experiment relative to the land cover change experiment (Irrigated Crops – Crops). Stippling indicates that changes are significant at the 5% level. JJA = June‐July‐August; SON = September‐October‐November. Gray box in panel (a) encloses the region within 70–90°E used for calculating the longitudinal averaged winds and humidity across South Asia in Figures 11 and 12.
