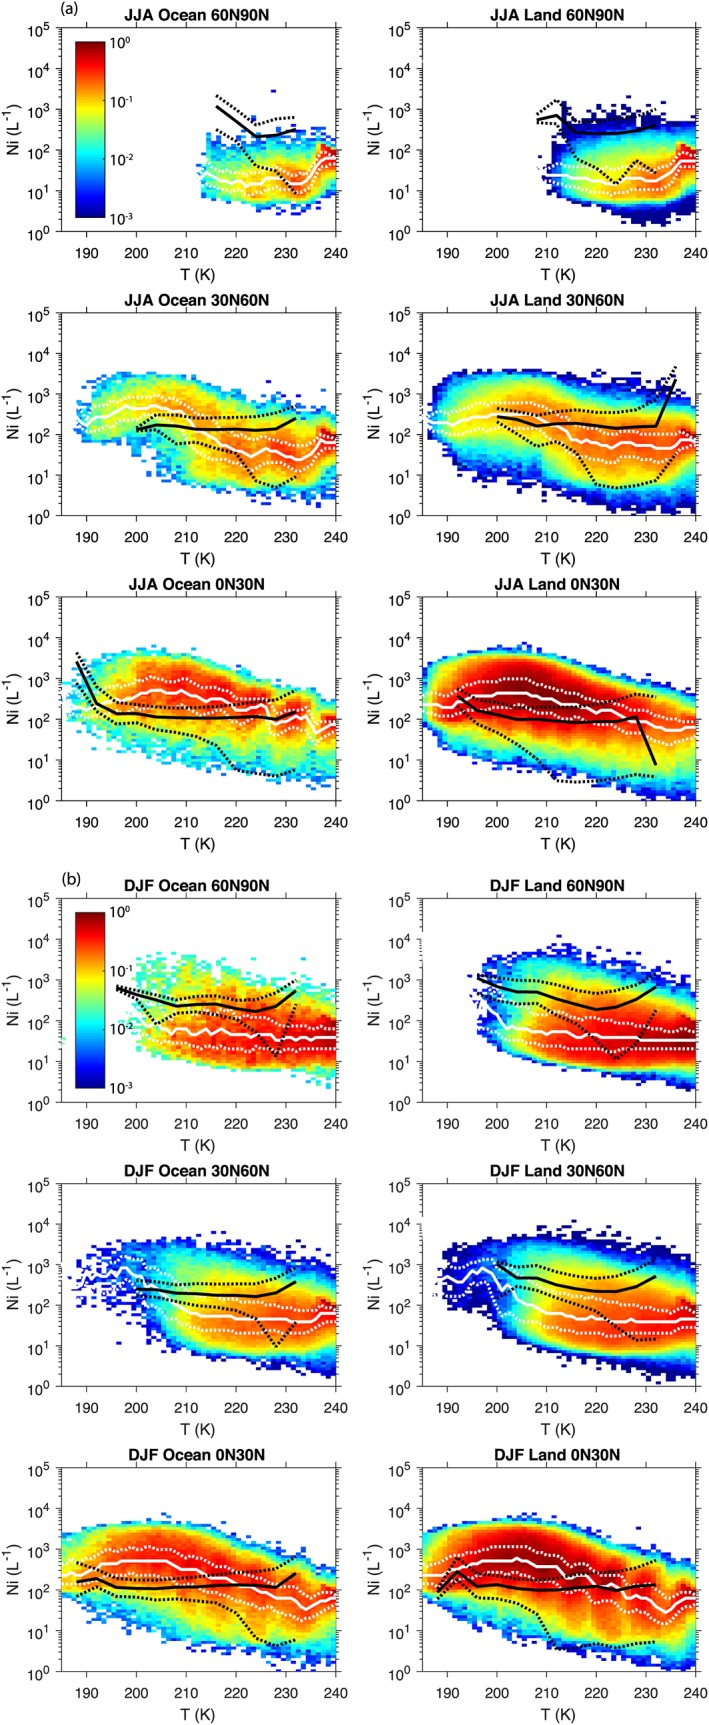
Figure 4.

(a) In‐cloud ice number concentrations for JJA in the Northern Hemisphere from the N(D)1 = 0 assumption for CALIPSO observations summarized by Mitchell et al. (2018) together with the dfbc simulation. The modeled cloud optical depth is restricted to the range from 0.3 to 3.0. (b) As in (a) for DJF in the Northern Hemisphere. The black full and dotted lines show the median, 25th and 75th percentile values of the observations, while the white lines as well as the color contours show the simulations. CALIPSO = Cloud‐Aerosol Lidar and Infrared Pathfinder Satellite Observation; JJA = June‐July‐August; DJF = December‐January‐February.
