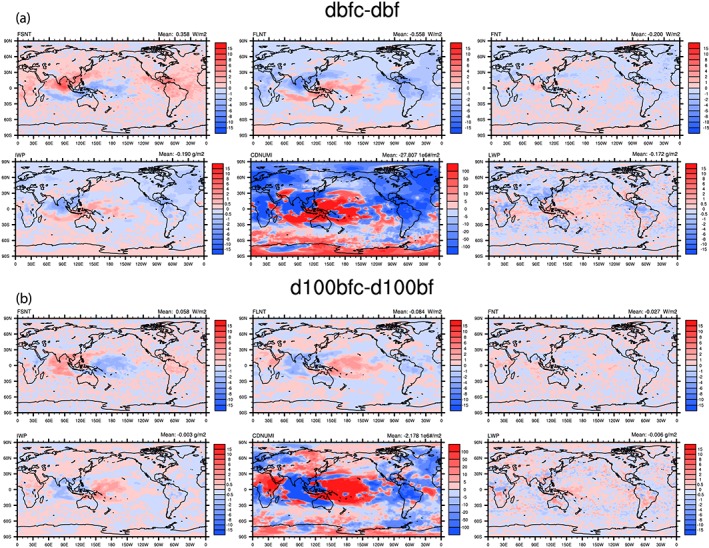
Figure 9.

Annual mean plots of shortwave forcing (FSNT), longwave forcing (FLNT), and net forcing (FNT) as well as the change in the vertically integrated ice water path (IWP), grid box‐averaged ice number concentration (CDNUMI), and liquid water path (LWP) for the difference between dbfc and dbf simulations (a) and the d100bfc and d100bf simulations (b).
