
Fig. 2.
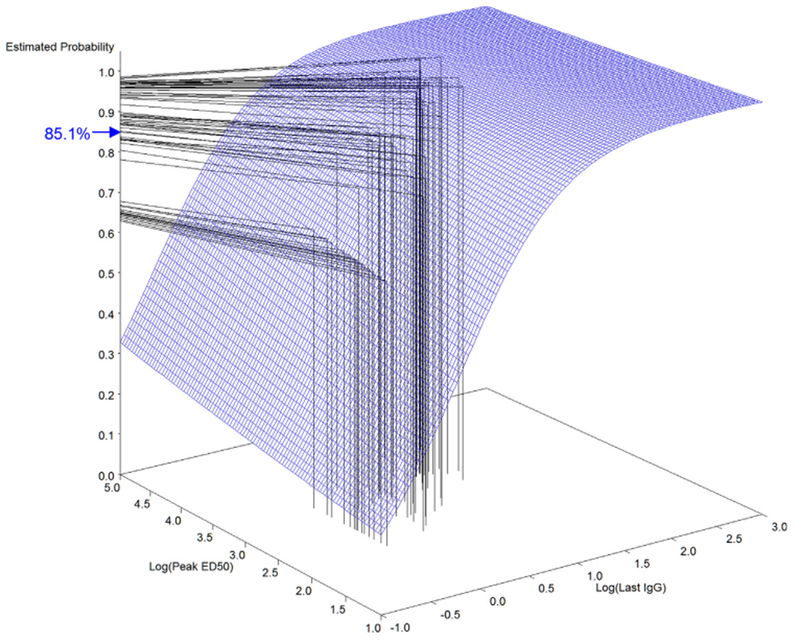
Dual-correlate model surface plot mapping of predicted probability of survival at month 42 in the Human 4-IM Study Group. The surface grid illustrates the relationship among peak ED50, last anti-PA IgG response and survival probability calculated from the NHP survival data. Key: (|) mapping of peak ED50 and last anti-PA IgG response of individual humans from the 4-IM study group measured at month 42; (–) mapping of immune response to predicted survival probability from the surface grid; (→) mean predicted survival probability for the human 4-IM cohort at month 42.