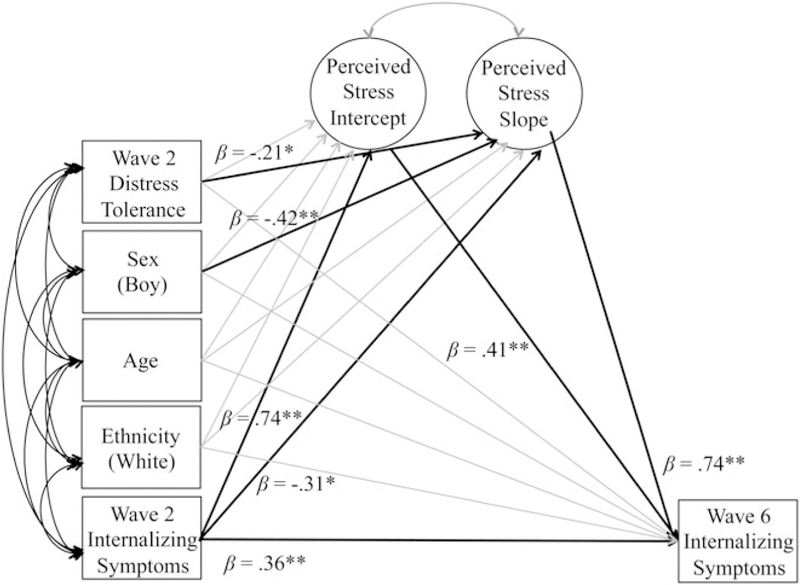
Figure 1.
Latent growth curve model with standardized path estimates. For parsimony, the figure does not include the repeated measures of perceived stress over time that serve as indicators for the latent intercept and latent slope in the full latent growth curve model. Bold paths represent significant effects, and gray paths represent nonsignificant effects. Unstandardized estimates are reported for significant paths that are indicated by *p < .05 and **p < .01.

